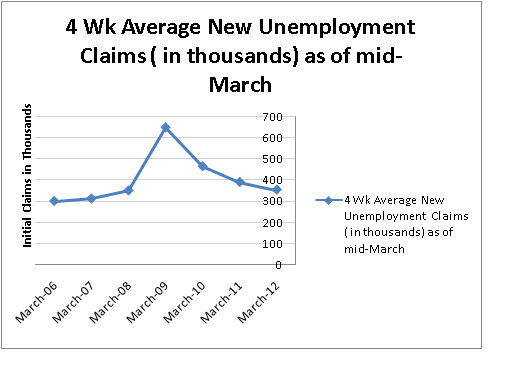
Are more or fewer people filing for unemployment now than last year or the year before?
The number of people getting laid off has continued to go down, down, down.
This chart shows the average number of first time unemployment claims (in thousands) for four weeks, ending with the third week of March, for the last six years.
- These are the seasonally adjusted numbers of first time unemployment claims. First time unemployment claims are people who have just been laid off and are filing new claims for unemployment.
- The number of initial claims was taken from THIS Department of Labor chart. I averaged the seasonally adjusted number of initial claims for the last week of February and the first three weeks of March for the past six years.
- The chart shows that we are now on a par with the number of claims in late February/early March 2008.

No comments:
Post a Comment
I appreciate intelligent comments and questions, including those that are at odds with anything posted here. I have elected not to screen comments before they are published; however, any comments that are in any way insulting, caustic, or intentionally inflammatory will be deleted without notice. Spam will also be immediately deleted.