AUG#: +130,000 jobs.

Unemployment up at 3.7%...AUG jobs under Trump HERE

Friday, November 6, 2015

What Was the Unemployment rate when Obama took office and Bush left office? (Updated for October 2015)

This report has been updated for AUGUST 2016 HERE


***********************************************************************
All August 2016 reports and details HERE.
***********************************************************************

This report is outdated.  For current reports, please click on one of the links above. 


What was the unemployment rate when Bush left office and Obama was inaugurated and took office? What was the unemployment rate when Obama came into office?
                                   7.8% 

What was the unemployment rate after obama's first full month in office (February 2009)?  
                                              8.3%

What was the unemployment rate at peak?  

                                                                            10.0%


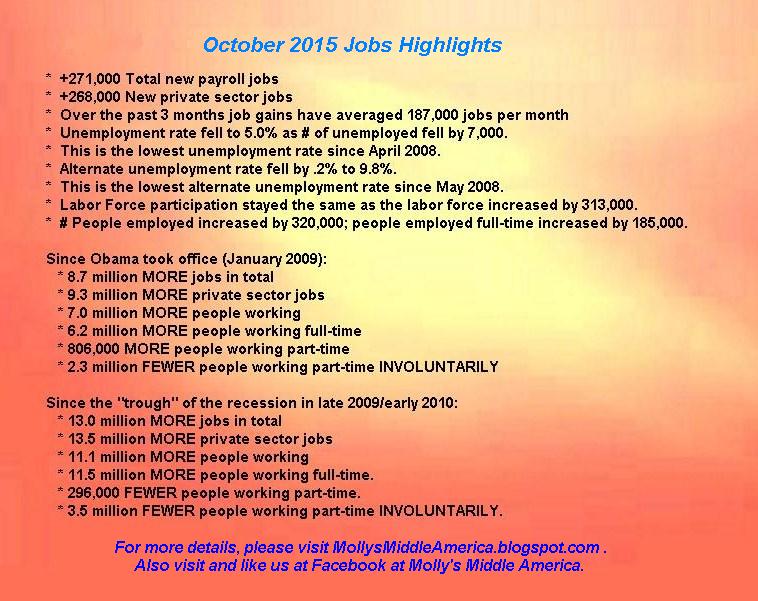
What is the unemployment rate now (October 2015)?    
                                                                                                            5.0%  

All Latest Jobs and Unemployment Reports HERE

How many people were looking for work when Obama was inaugurated; how many were working?  And how many people are looking for work and how many are employed now?

Please read below the graph.


The following chart shows the unemployment rate in three month intervals plus the last three months:


Why are there two lines, one for "Seas Adjusted" and one for "Unadjusted" in the chart above?  This is explained at the bottom of the article.
  • What Caused the Rise in Unemployment When Obama Took Office?  Obama caused the unemployment rate to rise?  (Continue reading; the answer  is below the fold.)
  •  What Was the Unemployment Rate When Bush Took Office?  How high did it rise?  (The answer is also below the fold.)  

How Many Jobs Has Obama Created or Lost? (October 2015 update)

This report has been updated HERE.
The following report is outdated.

How many NET jobs created or lost under Obama* as of October 2015? 
How many private sector jobs have been lost or added during Obama's presidency?


How many new jobs in the last 6 1/2 years since Obama was inaugurated?  How many Americans were working or employed when Obama took office... compared to now?


Continue below.....


*******************************************************************

November 2015 numbers were released Fri., Dec. 6.  Reports listed HERE.

******************************************************************


e


October 2015 Unemployment Rate, Jobs - Unexpected!


The October Jobs Reports were released Friday morning, November 6.  These are the best jobs numbers in several months, meaning that the Federal Reserve is more likely to raise interest rates at its next meeting in December.  


Not only was the whole report very decent, but the whole economy created
8,023,000 jobs over the past three years, from October 2012 until now.  That's the first time since late 2000 that the economy has created over 8 million jobs in three years.  Over those same three years, 6.4 million MORE people are working full-time.  (No, the definition of "full-time employment" according to the Bureau of Labor Statistics has not changed since Obama took office.)


October Highlights:

  • 271,000 total new payroll jobs; 268,000 new private sector jobs; a small 3,000 increase in the number of government jobs.)  These numbers are much higher than the 180,000 jobs that the pundits and prognosticators predicted.  Full-time/part-time breakdown will be available HERE later today.)  This is a welcome increase after the last two months of anemic job growth, and the numbers mark a return to the job growth that was typical earlier this summer.
  • The BLS changed their August and September estimates slightly.  August numbers were increased by 17,000 from +136,000 to +153,000, and the September estimate was decreased slightly from +142,000 to +137,000.  From the BLS:  "With these revisions, employment gains in August and September combined were 12,000 more than previously reported. Over the past 3 months, job gains have averaged 187,000 per month. "
  • The unemployment rate declined slightly to 5.0% as the number of unemployed decreased slightly by 7,000 and as the number of people employed increased by 320,000, and as 313,000 people entered the labor force.  
  • We now have 7,908,000 officially unemployed, the lowest number of unemployed since April 2008, 7 1/2 years ago.  As a result of more people in the labor force, the labor force participation rate increased very slightly from 62.36% to 62.43%.
  • The number of people not in the labor force (people in school, people retired, people home with children, etc.) decreased slightly to 94,513,000.  
  • Alternate unemployment rate fell from 10.0% to 9.8%.  That decline primarily reflected a decrease in the number of people who were working part-time "involuntarily" because they couldn't find full-time jobs. (That number has declined by 1,200,000 over the past two years.) 
  • As mentioned above, the labor force participation rate is stable at 62.4%.  The labor force participation rate has been under 62.5% for the past two months after being at 62.5% for the three prior months.  Year over year, we have about 800,000 MORE people in the labor force.  
  • Remember that there is NO ideal labor force size and most of the ongoing decrease in the labor force participation rate is due to Baby Boomers retiring in great numbers.
  • The overall number of people employed increased by  320,000.  
  • The number of people working full-time increased by 185,000 last month; the number of people working part-time increased by about 214,000 last month. However, the number of people working part-time INVOLUNTARILY declined by 269,000 and the number of people working part-time VOLUNTARILY increased by 483,000.  
  • There are 2.3 million MORE people working full-time than there were a year ago, and 507,000 FEWER people working part-time than a year ago.
  • Altogether, 2,062,000 payroll jobs have been ADDED in 2015 year to date.  That's an additional 206,000 jobs per month in 2015.
  • 1,976,000 private payroll sector jobs have been ADDED in 2015 year to date.  That's an additional 197,600 private jobs per month in 2015.
October 2015 reports: (As usual, notation on the links will be changed to "UPDATED for October" when the updated reports become available.  Not all reports are updated every month.)