First time unemployment jobless claims decrease by 6,000... four-week moving average # of claims also decreases slightly by 750.
Extended Benefits claims decline by another 46% as fewer states are eligible for Extended Benefits.
Percent of Unemployed People Receiving Benefits remains stable at 46.3%.
First time unemployment claims decreased by 6,000 over those reported last week. Last week's claims were revised upwards by 5,000. The four-week moving average decreased 750. As a whole, claims have been stable this spring, but they have tended up very slightly over the past three months, with slight upwards revisions in the last six of seven weeks. Four week averages have increased from 383,000 in April to 387,000 now in June.
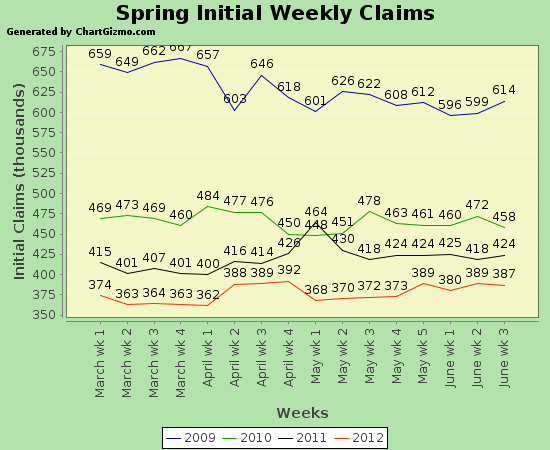
As usual, to put this into perspective, check out the red line on the chart below to see where jobless claims are now, in spring of 2012, compared to spring of the past three years.
From the current report:In the week ending June 23, the advance figure for seasonally adjusted initial claims was 386,000, a decrease of 6,000 from the previous week's revised figure of 392,000. The 4-week moving average was 386,750, a decrease of 750 from the previous week's revised average of 387,500.
The initial claims as announced last week were 387,000, so the claims from that week were revised upwards by 5,000.

The chart above is one of the BEST charts for understanding and observing changes in the weekly initial claims numbers over time. This year (red-2012) and the past three years (blue- 2009, green- 2010 and black- 2011) are marked in different colors. You can see that, as a trend, first time claims for unemployment have gone down SIGNIFICANTLY from one year to the next, even though there are variations within the year.
Be aware that: 1. These are first time claims, so people who have continued to receive benefits or who are losing any unemployment benefits would not be counted in these numbers. 2. They are seasonally adjusted, so most variations caused by weather or holidays are already included in these numbers. 3. As these are weekly numbers, they are more volatile than the monthly numbers.
Current Springtime Initial Claims Lowest Since 2008; Historical Claims Data Below
As a whole, the current numbers of initial claims continue to be the lowest springtime initial claims numbers since 2008, as can be seen on the chart above.
Average initial claims for this time of year for earlier years include:
Total number of people receiving unemployment insurance increases slightly from 45.8% to 46.3% of officially unemployed.
The weekly report also tells us the total number of people who are receiving unemployment benefits. For the week ending June 16th, 5,890,091 people are receiving unemployment benefits under one of the programs that are available (regular state, extended benefits, federal extended unemployment compensation, or a few other smaller programs). This compares with 12,720,000 people who are unemployed according to the monthly May unemployment situation report which was released three weeks ago. Those numbers, showing that 46.3% of the officially unemployed are receiving benefits, should make it clear that people do NOT need to be receiving unemployment insurance to be counted among the unemployed.
Extended Benefits Expire; 46% Fewer People Receive Extended Benefits
As we've been mentioning, many states have now "triggered" off of Extended Benefits. There are now only 6 states plus the District of Columbia for which Extended Benefits are still available. Those states include: New York, Rhode Island, West Virginia, Idaho, Nevada, and New Jersey. All other states have triggered off of Extended Benefits.
As of the week ending May 26th, 135,502 people were still receiving Extended Benefits. However, for the week ending June 2nd, this declined to 110,864, a large reduction as 24,638 people stopped receiving Extended Benefits. This is a reduction of 18%. For the week ending June 9th, this declined even further, to 59,538, an additional decrease of 46%. In late April, 350,579 people were receiving Extended Benefits. In two months, 83% of people who were receiving Extended Benefits are no longer receiving such benefits. We do not know how many of these 290,000 people found jobs or how many have another source of income.
Average initial claims for this time of year for earlier years include:
- June 2000: 293,000
- June 2001: 398,000
- June 2002: 388,000
- June 2003: 414,000
- June 2004: 349,000
- June 2005: 326,000
- June 2006: 305,000
- June 2007: 315,000
- June 2008: 378,500
June 2012 4-week moving average: 386,750
Total number of people receiving unemployment insurance increases slightly from 45.8% to 46.3% of officially unemployed.
The weekly report also tells us the total number of people who are receiving unemployment benefits. For the week ending June 16th, 5,890,091 people are receiving unemployment benefits under one of the programs that are available (regular state, extended benefits, federal extended unemployment compensation, or a few other smaller programs). This compares with 12,720,000 people who are unemployed according to the monthly May unemployment situation report which was released three weeks ago. Those numbers, showing that 46.3% of the officially unemployed are receiving benefits, should make it clear that people do NOT need to be receiving unemployment insurance to be counted among the unemployed.
Extended Benefits Expire; 46% Fewer People Receive Extended Benefits
As we've been mentioning, many states have now "triggered" off of Extended Benefits. There are now only 6 states plus the District of Columbia for which Extended Benefits are still available. Those states include: New York, Rhode Island, West Virginia, Idaho, Nevada, and New Jersey. All other states have triggered off of Extended Benefits.
As of the week ending May 26th, 135,502 people were still receiving Extended Benefits. However, for the week ending June 2nd, this declined to 110,864, a large reduction as 24,638 people stopped receiving Extended Benefits. This is a reduction of 18%. For the week ending June 9th, this declined even further, to 59,538, an additional decrease of 46%. In late April, 350,579 people were receiving Extended Benefits. In two months, 83% of people who were receiving Extended Benefits are no longer receiving such benefits. We do not know how many of these 290,000 people found jobs or how many have another source of income.
So, while a decrease in the number of people filing for initial claims is a good thing and indicates that fewer people are being laid off, a decrease in the total number of people getting unemployment insurance may only show that fewer people are eligible for unemployment insurance benefits.
Any questions or confusion, please leave a comment or email me!
Any questions or confusion, please leave a comment or email me!


