AUG#: +130,000 jobs.

Unemployment up at 3.7%...AUG jobs under Trump HERE

Thursday, May 31, 2012

ADP Report May 2012: 133,000 New Private Sector Jobs

ADP Numbers for May 2012: More Jobs but Not Enough


May Monthly Jobs Numbers
 Friday, June 1st. 

 Check back then!

The monthly jobs report from the payroll processor ADP is usually seen as a bellweather of the national jobs report from the Bureau of Labor Statistics that  is released a couple of days later.  This morning's ADP report seems to indicate stronger job growth than last month, but still "lackluster".  
Employment in the U.S. nonfarm private business sector increased by 133,000 from April to May on a seasonally adjusted basis. 
The estimated gain from March to April was revised down modestly, from the initial estimate of 119,000 to a revised estimate of 113,000.  Employment in the private, service-providing sector increased 132,000 in May, after rising a revised 119,000 in April. Employment in the private, goods-producing sector increased 1,000 in May. Manufacturing employment dropped 2,000 jobs, the second consecutive monthly decline. 
From MSNBC's Money, under a headline that says "Stock Futures Retreat on Weak Economic Data":

ADP's employment report showed companies created 133,000 jobs in May, underwhelming expectations. Economists had expected the private sector to have added 148,000 jobs in May, according to Thomson Reuters. In April, companies created 119,000 jobs.
When attempting to make any sense of this ADP report, here are a few things to consider:

  • This is an estimate based on ADP's survey of its payroll processing private-sector clients.  Over time, it moves in parallel with the government's BLS Establishment numbers, but it is not perfectly in synch with the government's numbers.  Also, the government reports may be more accurate in tallying small startups which may not be using a payroll processing service.  The ADP numbers usually run about 300,000 to 600,000 lower than the BLS private jobs numbers in total jobs, not in increases or decreases of jobs.
  • To reiterate what I mentioned last month, one of the things that seems to be more prevalent recently is that the stock market moves up or down not in concert with any reports of job growth (we haven't had any decline in total private jobs in two years.), but in concert with reports of job growth compared to what the pundits THINK the reports should say.  This ADP report, if supported by BLS data, still shows an increase of 133,000 jobs, which is an improvement from last month, but the pundits expected 148,000 jobs so it is seen as a disappointment.
  • Headlines are usually sensational and often absurd.  
The ADP report also shows that small (1-49 employees) and medium sized companies (50-499 employees) in the service-providing sector (vs. the manufacturing "goods-providing" sector) added the most jobs last month.  These segments were responsible for 118,000 of the added jobs.


Weekly Unemployment Claims Increase

First time unemployment jobless claims increase by 10,000... and the four-week moving average increases by 3,750.


First time unemployment claims increased by 10,000 over those reported last week.  The four-week moving average increased (3,750) as well, though it didn't increase as much as the four-week moving average decreased last week (5,500).  As a whole, claims have been stable this spring, but they have tended slightly up over the past four weeks, with slight upwards revisions every week.


As usual, to put this into perspective, check out the red line on the chart below to see where jobless claims are now, in spring of 2012, compared to spring of the past three years.

From the current report:


In the week ending May 26, the advance figure for seasonally adjusted initial claims was 383,000, an increase of 10,000 from the previous week's revised figure of 373,000. The 4-week moving average was 374,500, an increase of 3,750 from the previous week's revised average of 370,750.
The initial claims as announced last week were 370,000, so the claims from that week were revised upwards by 3,000. 


The chart above is one of the BEST charts for understanding and observing changes in the weekly initial claims numbers over time.  This year (red-2012) and the past three years (blue- 2009, green- 2010 and black- 2011) are marked in different colors.  You can see that, as a trend, first time claims for unemployment have gone down SIGNIFICANTLY from one year to the next, even though there are variations within the year.  


Be aware that:  1.  These are first time claims, so people who have continued to receive benefits or who are losing any unemployment benefits would not be counted in these numbers.  2.  They are seasonally adjusted, so most variations caused by weather or holidays are already included in these numbers.  3.  As these are weekly numbers, they are more volatile than the monthly numbers.

The current numbers of initial claims continue to be the lowest springtime initial claims numbers since 2008.  Continuing regular state claims, from people who are continuing to claim unemployment through the initial 20 to 26 week regular unemployment program, has continued to drop.  In the week ending May 12th, in unadjusted numbers, they dropped to 3,117,110 from 3,141,342.

Total number of people receiving unemployment insurance decreases.


The weekly report also tells us the total number of people who are receiving unemployment benefits.  For the week ending May 12th, 6,137,862 people are receiving unemployment benefits under one of the programs that are available (regular state, extended benefits, federal extended unemployment compensation, or a few other smaller programs).  This compares with 12,500,000 people who are unemployed according to the monthly April unemployment situation report which was released earlier in the month.  (The May numbers will be released tomorrow, June 1st.)  Those numbers, showing that less than half the officially unemployed are receiving benefits, should make it clear that people do NOT need to be receiving unemployment insurance to be counted among the unemployed.

Extended Benefits Expire


Many states have now "triggered" off of Extended Benefits.  Extended Benefits for those states, including California, Illinois, Florida, and several others, were due to end the weekend of May 12th.  On the current weekly report, as of the week ending May 12th, 312,434 people were still receiving Extended Benefits.  However, this number should decrease significantly as Extended Benefits have expired or are expiring for people in many states.  We can expect that the total number of people receiving unemployment benefits will declined to below 6,000,000 due to the end of those benefits.  


So, while a decrease in the number of people filing for initial claims is a good thing and indicates that fewer people are being laid off, a decrease in the total number of people getting unemployment insurance may only show that fewer people are eligible for unemployment insurance benefits.

Any questions or confusion, please leave a comment or email me!

How Does Wisconsin Rate in Jobs under Walker?

Here are the basic job stats and ratings for Wisconsin over the past 15 months since Scott Walker was elected governor:  
*Updated information at bottom


Total jobs in Wisconsin, private and government, have moved from 2,740,800 in December 2010, just before Scott Walker took office, up to 2,775,100 in June 2011, back down to 2,732,000 now.  

When we rank states, we take the percentage of jobs increased or decreased in an effort to level the playing field between small and large states.  Here are 7 jobs rankings for Wisconsin:

  • Month over month (March to April 2012):  44th with a decrease of 5,900 jobs.
  • Three month change (January to April 2012):  30th with an increase of 7,000 jobs.
  • Year to date (December 2011 to April 2012): 32nd with an increase of  12,200 jobs.    
  • Year over year (April 2011 to April 2012):  49th with a decrease of 21,400 jobs.
  • Since December 2010, the month before Walker took office:  Dead last (50th) with a loss of 8,800 jobs.

The following two measures can't be completely attributed to Scott Walker, but I believe he made them worse than they would have been otherwise.  (I'm going to do a couple of checks and add to this tomorrow.)
  • Ranking since Obama took office (from January 2009 to April 2012):  48th with a decrease of 83,400 jobs. 
  • Ranking since the "trough" of the recession in jobs (February 2010):  45th with an increase of 17,500 jobs.
The average state has now added 2.71% jobs from the "trough" of the recession in jobs in February 2010.  Wisconsin has only added 0.64%, less than one percent, since that time.  Wisconsin's neighbors since the trough:  
  • Illinois:  Up 1.92%  (36th)
  • Minnesota: Up 2.89% (18th)
  • Michigan:  Up 4.08% (7th)
*Update 5/31/2012:  These numbers were better before Walker took office.  Here's how the rankings since Obama took office and since the "trough" of the recession looked before Scott Walker took office:
  • Ranking since Obama took office (from January 2009 to December 2010):  31st with a decrease of 74,600 jobs. 
  • Ranking since the "trough" of the recession in jobs (February 2010 to December 2010):  28th with an increase of 26,300 jobs.
Compare these rankings with the rankings since Walker was elected above.
    
    (Note:  These numbers are based on the monthly Bureau of Labor Statistics Regional and State Employment and Unemployment Reports.  The BLS reports include month over month and year over year numbers.  Data for my monthly reports is taken from that BLS report copied to a spreadsheet every month.  If you want or need more details, please email me or leave a comment!)

    Gallup Had Something Wrong and I Caught Them!

    Too bad I didn't catch this four weeks ago.  


    Gallup posted a short article comparing their unemployment rate with the standard BLS unemployment rate.  Their seasonally unadjusted rate is higher than the BLS' unadjusted rate for April and the Gallup economist was explaining and discussing this.  (Notice in the graph below from the Gallup site that the BLS and Gallup numbers tend to rise and fall in tandem, though BLS may be higher than Gallup for any one month or vice verse.)  

    (What does any of this mean for the big Friday jobs report--- or for any one of us out here in jobs land?  Though estimates are all over the place, and they are generally pretty glum, we'll just have to see.  By "pretty glum", I mean that most are suggesting that we won't add enough jobs; not that we are going to be losing jobs.)  


    In any case, this was the paragraph that caught my attention:

    The slow economy suggests April new jobs created were likely a lot closer to the BLS payroll increase of 115,000 than the household survey's nearly 600,000. It also suggests that the unadjusted unemployment rate is probably closer to Gallup's 8.3% than the government's 7.7%. In turn, the foundation supporting the government's decline in its seasonally adjusted unemployment rate to 8.1% seems a lot weaker than that supporting Gallup's survey results showing an increase in the adjusted unemployment rate in April.     


    Except that Gallup was referring to seasonally adjusted jobs numbers when they referred to the 115,000 job increase and seasonally UNadjusted numbers when they mention the household survey's 600,000 extra workers.

    So I took keyboard in fingers and explained the problem.  We'll see if my comment makes it through the moderation process.

    Gallup, you are mixing apples and oranges on this one.  You are using seasonally UNadjusted numbers on the household survey.. which makes sense as the Gallup rate you are comparing it to is also seasonally unadjusted.  As you mention, the BLS shows that 600,000 more people reported themselves as employed in  seasonally unadjusted numbers in April.

    But then you mention that the BLS Establishment survey's (jobs) numbers seem to support Gallup's numbers vs. the BLS numbers.  Not so.  The 115,000 jobs that you mention is the BLS estimate of jobs added in April in seasonally ADJusted numbers.  BLS actually estimates (in UNadjusted numbers) that 900,000 jobs were added in March. 

    March to April is always a hiring time in unadjusted numbers.  Over the past 20 years, an average of 875,000 "real" jobs in UNadjusted numbers have been added between March and April.  Those 875,000 "real" jobs have resulted in an average of 118,000 jobs in ADJusted jobs numbers between March and April over those last 20 years.
    If you don't understand this seasonal adjustments stuff, please read HERE.


    Note:  As of 4 p.m. CDT 5/31/2012, my comment has still not been posted.  I doubt that it will ever see the light of day.


    May Monthly Jobs Numbers
     Friday, June 1st. 
     Check back then!


    Tuesday, May 29, 2012

    Has Unemployment Increased Since 2011? In 2012?

    No!

    Unemployment is lower and employment is higher than it was in 2011!  All measures of underemployment are lower than they were in 2011 as well.

    This is an example of how misleading the media can be.  I see so many searches on "jobs lost in 2011" or "number of jobs lost so far in 2012."


    We have had 26 (twenty-six) straight months of job growth in the private-sector in this country, and 19 (nineteen) straight months (starting after the Census 2010 people were let go) of job growth overall.

    But I hear the "real" unemployment rate is 14 or 16 or 20 percent!  The government is lying to us!


    No, it is not.  Keep watching this blog for more information about the supposed "true" unemployment rate in the next few days.   And ponder a bit:  If you were counting the unemployed, who would you count as unemployed?  Who would you not count as unemployed?  Would you only count people looking for work?  In the last month?  In the last year?  Would you count retired people?  Kids in high school?  Parents at home with children?  Disabled people?         


    Here's a little graph on the various "pieces" of employment and unemployment and how they compare for the months of April and October for the past four years:


    Someone has got to be lying!  I've heard that MILLIONS of people are dropping out of the labor force.  This shows that ONLY a million people are discouraged now, that number is coming down, and a half a million people were discouraged BEFORE everything hit the skids in 2008.

    Well, yeah.. How about that?

    People ARE leaving the labor force, but there is no indication that millions of them are dropping out due to discouragement.  The largest number of people dropping out of the labor force are people 55 and over, most of whom are probably retiring.  More about this as well in the coming days.  

    Let's look at the above chart.  These are the "pieces" of the labor force that create the U-6 alternate un/underemployment rate.
    • The "official" unemployed are people who are unemployed and actively (within the last month) looking for work.
    • The part-timers who want full-time work are people who are working part-time because they cannot find full-time work.  
    • The "discouraged" are people who have looked for work in the past year, but not in the past month because they are discouraged, not for any other reason.
    • The other "marginal workers" are people who were available to work and have looked for work in the past year, but have not looked for work in the past month due to family responsibilities,  school or training, illness, child-care, transportation problems, or other similar issues.
       
    How Many Jobs Were Created in 2011? (Click HERE!)

    A few other facts about 2011 and 2012:
    • Number of jobs total end of 2010:  130,346,000
    • Number of jobs total end of 2011/beginning of 2012:  132,186,000
    • Number of jobs total now:  132,989,000
    Private sector jobs:
    • Number of private sector jobs end of 2010:  108,088,000
    • Number of private sector jobs end of 2011/beginning of 2012:  110,193,000
    • Number of private sector jobs now:  111,020,000
    Number of People Employed:
    • Number of people employed end of 2010:  139,220,000,  
    • Number of people employed end of 2011/beginning of 2011:  140,790,000
    • Number of people employed now:  141,865,000
    Unemployment (U-3) rate:
    • End of 2010:  9.4%
    • End of 2011/Beginning of 2011:  8.5%
    • Now:  8.1%

    Underemployment (U-6) rate:
    • End of 2010:  16.6%     
    • End of 2011/Beginning of 2011:  15.2%
    • Now:  14.5%

    Friday, May 25, 2012

    Initial Jobless Claims For the Past Four Years: How Quickly We Forget!

    Look at how much our weekly initial unemployment (jobless) claims have decreased since those months shortly after Obama was inaugurated:


    (See the August update at the bottom of this post.)


    Things were pretty intense in late 2008/early 2009.  If you've forgotten, a quick look at this graph should refresh your memory.  (And weekly initial claims were already decreasing by the first week of March 2009, just a week or two after the ARRA stimulus was passed!)

    Check out the red line on the chart above to see where jobless claims are now, in spring of 2012, compared to the springs of the past three years, especially spring of 2009 (blue line).

    The charts I include in my weekly initial unemployment claims articles are among the BEST charts for understanding and observing changes in the weekly initial claims numbers over time.  This year (red-2012) and the past three years (black- 2011, green- 2010, and blue- 2009 ) are marked in different colors.  You can see that, as a trend, first time claims for unemployment have gone down SIGNIFICANTLY from one year to the next, even though there are variations within the year.  


    Be aware that:  1.  These are first time claims, so people who have continued to receive benefits or who are losing any unemployment benefits would not be counted in these numbers.  2.  They are seasonally adjusted, so most variations caused by weather or holidays are already included in these numbers.  3.  As these are weekly numbers, they are more volatile than the monthly numbers.

    Update as of mid-August:


    Thursday, May 24, 2012

    Weekly Initial Jobless Claims Stable

    First time unemployment claims stable... and the four-week moving average decreases!


    First time unemployment claims were the same as reported last week, though the four-week moving average has decreased by 5,500.  Claims have been stable this spring, as seen on the attached chart.


    Check out the red line on the chart below to see where jobless claims are now, in spring of 2012, compared to spring of the past two years.

    From the current report:

    In the week ending May 19, the advance figure for seasonally adjusted initial claims was 370,000, a decrease of 2,000 from the previous week's revised figure of 372,000. The 4-week moving average was 370,000, a decrease of 5,500 from the previous week's revised average of 375,500.
    The initial claims as announced last week were 370,000, so the claims from that week were revised upwards by 2,000. 


    The chart above is one of the BEST charts for understanding and observing changes in the weekly initial claims numbers over time.  This year (red-2012) and the past two years (green- 2011 and blue- 2010) are marked in different colors.  You can see that, as a trend, first time claims for unemployment have gone down SIGNIFICANTLY from one year to the next, even though there are variations within the year.  


    Be aware that:  1.  These are first time claims, so people who have continued to receive benefits or who are losing any unemployment benefits would not be counted in these numbers.  2.  They are seasonally adjusted, so most variations caused by weather or holidays are already included in these numbers.  3.  As these are weekly numbers, they are more volatile than the monthly numbers.

    You an also see that the April bulge, visible during the 1st-2nd week of April in all three years, has ended in 2012, with a return to first time claims levels of March.  As a comparison, the initial claims in April were around 260,000 in the year 2000, and about 300,000 in 2006 and 2007.  The current numbers of initial claims are the lowest springtime initial claims numbers since 2008.

    The weekly report also tells us the number of people who are receiving unemployment benefits.  For the week ending May 5th, 6,168,620 people are receiving unemployment benefits under one of the programs that are available (regular state, extended benefits, federal extended unemployment compensation, or a few other smaller programs).  This compares with 12,500,000 people who are unemployed according to the monthly April unemployment situation report which was released last week.  Those numbers, showing that only half the officially unemployed are receiving benefits, should make it clear that people do NOT need to be receiving unemployment insurance to be counted among the unemployed.

    Extended Benefits Expire


    Many states have now "triggered" off of Extended Benefits.  Extended Benefits for those states, including California, Illinois, Florida, and several others, were due to end the weekend of May 12th.  On the current weekly report, as of the week of May 5th, 299,955 people are still receiving Extended Benefits.  However, within two weeks, we would expect to see the numbers of people receiving unemployment benefits in total and Extended Benefits in particular decline quite a bit due to the end of those benefits.  


    So, while a decrease in the number of people filing for initial claims is a good thing and indicates that fewer people are being laid off, a decrease in the total number of people getting unemployment insurance may only show that fewer people are eligible for unemployment insurance benefits.

    Any questions or confusion, please leave a comment or email me!

    Tuesday, May 22, 2012

    Remember those ZERO Jobs last August? Revisions change things..


    Do you remember last August, when it was reported that we had no net job growth?


    The Republicans had a field day with that ZERO. But the next month, that estimate was revised upwards, and that estimate has continued to be revised upwards. The most recent estimate is that we added 85,000 jobs during that "zero" month, followed by over 200,000 jobs in September.


    The BLS CES (Establishment Survey) archives now show that we gained something like 400,000 jobs over that somewhat dismal third quarter. We also have the Business Employment Dynamics Report, which I’ve only started using, which shows that we actually gained about 750,000 jobs in that third quarter. That is actually more in line with the CPS (BLS Current Population Survey) numbers that show 722,000 more people as employed in that quarter.
    So the dingy third quarter 2011, marked by the debt reduction standoff that harmed both the President and Congress, was actually part of “the largest net job gain since first quarter 2006″.

    Here's how the initial jobs numbers compare to current revisions over the past 12 months:  (Notice that buried "zero"?) 


    My point is that we can’t look at one month.. or even two… to determine if the job market is horrible or not that horrible. The March numbers were upwardly revised by about 34,000 jobs, and the April numbers may be revised as well.  We may later determine that they weren’t that bad after all.  Despite all of the whining about the April jobs numbers, we now have 168,000 more jobs than we thought we had on April 6, when the March numbers came out. 

    What Has Obama Done to Create Jobs?

    Can a President do anything to create jobs?  


    Yes and no.  Fiscal and economic policies, government spending or lack thereof, general confidence, all have an impact on either the number of jobs directly or the economic condition of a country which will influence the number of jobs.  But to say that a President is strictly responsible for the jobs created or not created during his administration is folly.  International tensions, in particular, tensions involving oil producing countries, can hamper economic growth.  A cooperative Congress can help a President pass policies that stimulate job growth; an obstructionist Congress can hinder job growth.  Economic conditions abroad, in Europe or Asia, can also help or hinder job growth here.

    But here are three things that Obama was primarily responsible for that have helped with job growth:

    1.  Stimulus.  According to the Congressional Budget Office, the stimulus was responsible for either the creation or the savings of at least three million jobs during the 2009 to 2011 period.  That does not include the multiplier effect, in which people with jobs buy things and keep other people employed.  


    2.  GM Bailout.  The estimates of how many jobs were created or saved by the auto bailout, in particular, the GM bailout are from 1 million to 1.7 million.  Those jobs are providing at least 8 billion a year in income tax revenue, not counting sales tax revenue, FICA payments, and NO unemployment payments for the people still working.  HERE's a decent link explaining some of the issues. 


    3.  Unemployment extensions and payroll tax cuts.  How many people have been kept out of abject poverty by up to two years of unemployment compensation?  And what was the multiplier effect of those millions of people receiving unemployment compensation.. as well as the multiplier effect of payroll cuts...on the economy as a whole?

    Here's Media Matters on the issue from last December quoting studies done by the Economic Policy Institute:

    Of the $72 billion increase in GDP related to continuing the unemployment insurance benefit extensions through 2012, some 37.4 percent, or $26.9 billion, would be recouped in higher revenues, as more people and firms pay taxes, and in lower expenditures. Consequently, the effective cost to the budget of continuing the UI benefits extension for a year is $18.1 billion instead of $45 billion. This means that the continuation of unemployment insurance benefit extensions through 2012 would save 560,000 jobs at an effective cost of around $32,000 per position. That alone is a good deal, but when we remember that these expenditures would assist millions of families of the long-term unemployed during the worst downturn in seven decades, the case for continuing the extensions could not be more clear. 


    Now:  

    Did all of the people complaining about job growth under Obama also complain about job growth under Bush?  Job growth under Obama, with much more trying circumstances, is just about the same or a bit ahead of job growth under Bush at a similar time in their respective presidencies.  Check out the article. 

    Sunday, May 20, 2012

    Republicans Want People to Work Until They Drop

    Why is the labor participation rate going down?  And is that a bad thing?  Is that also Obama's fault?

    As the unemployment rate has started to decline, the Republicans now want to move the goalposts.  They want to count unemployment using the U-6 underemployment rate instead of the U-3 unemployment rate that has been used forever.  (More about this later.)   

    And they want to say that people who are "not in the labor force" are really "unemployed".  Of course, most of those people "not in the labor force" are retired, in school, home with children, disabled.  The Republicans haven't yet managed to keep people from retiring, so they are now complaining about the declining "labor participation rate".

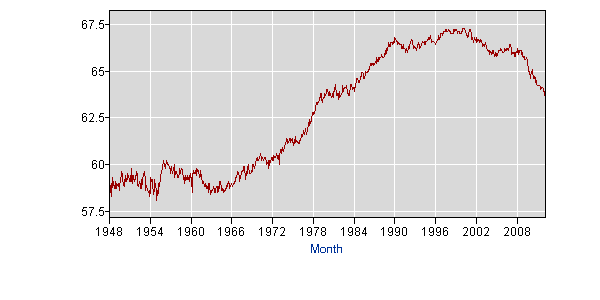
    Here's what the labor participation rate graph (from the BLS website) looks like over the last 60 years:


    Labor Participation Rate 1948 to present
    Labor Participation Rate in the U.S. 1948 to present


    This article at the National Journal talks about a poll in which people discuss whether or not they think they are better off than they were a year ago and whether or not they think they will be better off a year from now.  

    Of course, many of the comments start with, "I'll be much better off when Obama is out of the White House." I did address some of those people, and you can see some of my comments down below the article.  But here is one comment by "Mojo the Awkward" that centers on the labor participation rate that I was easily able to debunk:

    Here's a cute factoid. The month Obama took office, the labor force declined by more than 700,000. The average over the previous months was around 25,000.
    The number of Americans 'not in the labor force' had risen steadily under Bush (although Bush did also create millions of net jobs - six million in his second term, which is rather more impressive than Obama's net 129,000 to date) - but the rate of its increase became steeper the day Obama was sworn in and has kept up that accelerated pace since (which is why there are now nearly 90 million Americans 'not in the labor force' but conveniently omitted from headline unemployment stats).
    (I did not address his comments about Bush in my reply.  But I do talk about comparisons between Bush and Obama, including this poster's assertions, HERE, in the article "Private Sector Job Growth Higher Under Obama than Bush?") 

    My reply to this person: 
    Hard to imagine where people get their numbers.. None of this stuff is hard to find.
    Do you know what the "labor force" is?  If not, I would suggest that you look it up.  In any case, the average labor force throughout 2008 was about 140,000 more than the average throughout 2009.  
    What is the labor force participation rate anyway? 
    The number "not in the labor force", while impacted by economic factors, is mostly influenced by demographics.  The labor force participation rate is the percentage of the number of people in the "civilian non-institutional population 16+" who are either working or actively looking for work.  The people who are not either working nor actively looking for work are "not in the labor force".  
    The average labor force participation started to take off in the late 60's/early 70's, and it peaked at 67.1% in Clinton's second term.
    It's gone down for many reasons, mostly due to demographics.  We've added 29,000,000 people to our "civilian non-institutional population 16+" since January 2001, and a whopping 21,600,000 of them are people who are 55 or over.  Since the Republicans haven't found a way (yet) of forcing us to work until we keel over, people 55+ are actually STILL retiring.  
    Not only do the despicable Republicans want to cut benefits that might help older people retire, now they want to play with employment statistics and count seniors among the "unemployed" as well, as you attempted to do.  Why don't you and other Republican supporters think that people, after decades of working, deserve to retire while they are in decent health and can enjoy their golden years?  And the simple fact that most older people can still manage to retire (perhaps because the stock market is back up?) is somehow used AGAINST Obama?
    Something else is happening that you Republican supporters might not be aware of:  The age at which the Baby Boomers can retire with full Social Security is now 66.   The vanguard of the Baby Boomers, people born in 1946, turn 66 this year.  We can expect that a hundred or two hundred thousands of such people are going to be exiting the labor force each month this year.. and each month for years ahead.
    A lower labor participation rate isn't necessarily a bad thing. 
    Let's be honest:  As much as the Republicans want to blame Obama for the falling labor participation rate,  a lower labor participation rate isn't necessarily a bad thing.  Back in the heyday of unions and high marginal tax rates, the labor participation rate was low as families could actually survive on ONE salary.  One parent, usually Mom, could actually stay home with the kids.  
    The labor participation rate among older people went down around the time that Medicare was established.  Not a bad thing..  People didn't have to hang onto their jobs until they dropped to maintain medical insurance.  A lower labor participation rate also means that kids can go to and stay in school, high school or college, and many of them don't HAVE to work.  They can concentrate on their studies at least during the school year, which, as a parent and teacher, I always felt was a good thing. 
    And we do ask people who are "not in the labor force" if they want to work (but haven't looked for some reason).  93% of them don't want to work.  Among people 55+, that number is even higher.  About 97% of those people do not want to work.
    But you and other Republicans think it is a bad thing that people who want to retire can still retire.  
    O.K., O.K., I know that complaining about the labor force participation rate is not the same as telling old people that they should work until they drop.  But if you are going to count an 80 year old Grandpa who hasn't worked for 20
    years as "unemployed", well.. what's the connotation of "unemployed"?


    In any event, will the original poster reply to me?  So far only crickets. 

    Thursday, May 17, 2012

    Weekly Initial Unemployment Claims Unchanged (Week ending 5/12)

    Initial Unemployment Claims Week Ending 5/19 HERE!


    First time unemployment claims stable (Week ending 5/12).


    First time unemployment claims were the same as reported last week, though the four-week moving average has decreased.  Claims have been stable this spring, as seen on the attached chart.

    From the current report:

    In the week ending May 12, the advance figure for seasonally adjusted initial claims was 370,000, unchanged from the previous week's revised figure of 370,000. The 4-week moving average was 375,000, a decrease of 4,750 from the previous week's revised average of 379,750.
    The initial claims announced last week were 367,000, so the claims from that week were revised upwards by 3,000. 


    The chart above is one of the BEST charts for understanding and observing changes in the weekly initial claims numbers over time.  This year (red-2012) and the past two years (green- 2011 and blue- 2010) are marked in different colors.  You can see that, as a trend, first time claims for unemployment have gone down SIGNIFICANTLY from one year to the next, even though there are variations within the year.  


    Be aware that:  1.  These are first time claims, so people who have continued to receive benefits or who are losing any unemployment benefits would not be counted in these numbers.  2.  They are seasonally adjusted, so most variations caused by weather or holidays are already included in these numbers.  3.  As these are weekly numbers, they are more volatile than the monthly numbers.

    You an also see that the April bulge, visible during the 1st-2nd week of April in all three years, has ended in 2012, with a return to first time claims levels of March.  As a comparison, the initial claims in April were around 260,000 in the year 2000, and about 300,000 in 2006 and 2007.  The current numbers of initial claims are the lowest springtime initial claims numbers since 2008.

    The weekly report also tells us the number of people who are receiving unemployment benefits.  For the week ending April 21st, 6,273,624 people are receiving unemployment benefits under one of the programs that are available (regular state, extended benefits, federal extended unemployment compensation, or a few other smaller programs).  This compares with 12,500,000 people who are unemployed according to the monthly April unemployment situation report which was released last week.  Those numbers, showing that only half the officially unemployed are receiving benefits, should make it clear that people do NOT need to be receiving unemployment insurance to be counted among the unemployed.

    Extended Benefits Expire


    Many states have now "triggered" off of Extended Benefits.  Extended Benefits for those states, including California, Illinois, Florida, and several others, were due to end last weekend on May 12th.  On the current weekly report, as of the week of April 28th, 305,000 people are still receiving Extended Benefits.  However, within three weeks, we would expect to see the numbers of people receiving unemployment benefits in total and Extended Benefits in particular decline due to the end of those benefits.  So, while a decrease in the number of people filing for initial claims is a good thing and indicates that fewer people are being laid off, a decrease in the total number of people getting unemployment insurance may only show that fewer people are eligible for unemployment insurance benefits.

    Any questions or confusion, please leave a comment or email me!

    Saturday, May 12, 2012

    Happy Mother's Day! Social Security Needs to be Strengthened!


    Social Security benefits need to be strengthened, not cut.


    On average, women receive lower Social Security benefits than men. This Mother's Day, let's honor the women in our lives by supporting proposals that would improve benefits, not cut them. Here is a video from our Capitol Hill briefing this morning: http://cs.pn/LwSvIN 

    Happy Mother's Day! 

    Remember that the fastest growing segment of our population is women 55+.  We need a strong Social Security now more than ever to protect our mothers and the mothers of the future.  (And fathers as well...)   

    More comments HERE.


    Thursday, May 10, 2012

    Happy Mother's Day! Women 55+ Lead Population Growth!


    Women 55+ are the fastest growing population group in the country over the past 11 years!


    We've added 29,000,000 people to the "civilian non-institutional population 16+" since January 2001, the month that George Bush entered the White House.  37.4% of those people are women 55+, that big blue piece of pie above.  Now the number of men 55+ has also gone up substantially; 37.3% of those additional 29 million people are men 55+.  Notice the big red piece of pie.  (The "civilian non-institutional population 16+" is the base demographic used to determine employment, unemployment, and that elusive "not in the labor force" contingent.)  


    No, this doesn't mean that millions of people over 55 are entering this country; it means that the huge Baby Boomer cohort, born in 1946 until about 1964, is getting older.  Expect the number of people 55+ to increase for another 5 - 10 years until the Baby Busters start to hit 55.  Now, the implications of this aging population are great:  Fewer people working, more people getting older and disabled, and more stress on our social safety net and health care systems.    

    But for now, Happy Mother's Day, Moms & Grandmas 55 and over.  There are certainly a lot of us!  (And Happy Mother's Day to all of the Moms and Grandmas under 55 as well!)

    Weekly Initial Unemployment Claims Numbers Stabilize

    First time unemployment claims decrease.


    First time unemployment claims dipped slightly, but are now stable over the last couple of months, as shown by the attached chart.  From the current report:
    In the week ending May 5, the advance figure for seasonally adjusted initial claims was 367,000, a decrease of 1,000 from the previous week's revised figure of 368,000. The 4-week moving average was 379,000, a decrease of 5,250 from the previous week's revised average of 384,250. 


    A few comments:  1.  These are first time claims, so people who have continued to receive benefits or who are losing any unemployment benefits would not be counted in these numbers.  2.  They are seasonally adjusted, so most variations caused by weather or holidays are already included in these numbers.  3.  As these are weekly numbers, they are more volatile than the monthly numbers.


    The chart above is the BEST chart for understanding and observing changes in the weekly initial claims numbers over time.  This year (red-2012) and the past two years (green- 2011 and blue- 2010) are marked in different colors.  You can see that, as a trend, first time claims for unemployment have gone down SIGNIFICANTLY from one year to the next, even though there are variations within the year.  

    You an also see that the April bulge, visible during the 1st-2nd week of April in all three years, has ended in 2012, with a return to first time claims levels of March.  For reference, the initial claims in April were around 260,000 in the year 2000, and about 300,000 in 2006 and 2007.  These are the lowest springtime initial claims numbers since 2008.

    The weekly report also tells us the number of people who are receiving unemployment benefits.  For the week ending April 21st, 6,423,383 people are receiving unemployment benefits under one of the programs that is available (regular state, extended benefits, federal extended unemployment compensation, or a few other smaller programs).  This compares with 12,500,000 people who are unemployed according to the monthly April unemployment situation report which was released last week.  Those numbers, showing that only half the officially unemployed are receiving benefits, should make it clear that people do NOT need to be receiving unemployment insurance to be counted among the unemployed.

    Any questions or confusion, please leave a comment or email me!