Watch for updates to this page over the weekend (April 7th to 9th)!
August 2016 Highlights:

The economy added 151,000 jobs, an average number of new jobs, and the unemployment rate was stable at 4.9%.- Over the past 3 months, job gains have averaged 232,000 per month. Since the beginning of the year, job gains have averaged 182,000 per month.
- The number of employed people went up by 97,000. The number of unemployed people went up by 79,000 as 176,000 people joined the labor force, meaning that they started working or started looking for work. That is a NET number.
- 409,000 MORE people are working full-time and 388,000 FEWER people are working part-time in August.
- There are 2.6 million MORE people working than a year ago, with 2.3 million MORE people working full-time and about 250,000 MORE people working part-time than a year ago. There are about 700,000 MORE people working part-time VOLUNTARILY than a year ago and about 430,000 FEWER people working part-time INVOLUNTARILY than a year ago.
- There were 126,000 MORE private sector jobs, and 25,000 MORE government jobs in August.
- The alternate unemployment rate (U-6) has been stable at 9.7% this month and it has averaged 9.7% during the year of 2016. This is down0.6% from a year ago.
- Government jobs include jobs at the federal, state, and local levels, including public school teachers. It does not include military jobs, though it does include civilian Defense workers who are employed directly by the government. Local government accounted for 24,000 of the 25,000 increase in government jobs.
- Employment in mining, construction, and durable goods manufacturing was down slightly in August, with employment in service sectors, including retail trade, transportation, financial activities, professional services, education and health services, leisure and hospitality all showing moderate increases.
- Year-to-date in 2016, 1,630,000 people (net) have entered the labor force with 1,685,000 more people employed, and 1,698,000 MORE people employed full-time. That means that people are entering the labor market AND finding full-time jobs.
- The Labor Force participation rate has been VERY stable since 2014, varying between 62.42% and 63.02%. It was 62.82%in August.
- Remember that there is NO ideal labor force size, and most of the overall decrease in the labor force participation RATE over the last few years has been due to Baby Boomers retiring in great numbers.
From the BLS report:
The change in total nonfarm payroll employment for June was revised down from +292,000 to +271,000, and the change for July was revised up from +255,000 to +275,000. With these revisions, employment gains in June and July combined were 1,000 less than previously reported. Over the past 3 months, job gains have averaged 232,000 per month.
(For the record, 8 years ago, in August 2008, we lost 266,000 jobs as the country continued its slide into the worst recession in 80 years.)
August 2016 reports: (Notation on the links will be changed to "UPDATED for August" when the updated reports become available later today or over the weekend. Not all reports are updated every month.)
- What Was the Unemployment Rate When Obama Took Office (compared to today)? Not yet updated
- How Many Jobs Created or Lost Under Obama? - Full-time vs. Part-time? - Not yet updated
- Democrats rock at full-time job creation. - Updated for July
- How Many Jobs Were Created in 2016? - Updated for August
- Jobs Lost/Gained Year by Year Since 1999 - Not yet updated.
- 93 Million People Not in the Labor Force? Who are those people? Latest update is for April 2015
More highlights and reports will continue to be posted here over the coming days and weeks. Please check back!
Expectations and the ADP Report:
The pundits were expecting job growth in the vicinity of 180,000 new jobs. The ADP report, which was released Wednesday, August 31st, showed an increase of 177,000 private sector jobs. Over time, the numbers in the ADP report tend to follow those in the BLS government report very closely. In the ADP report, Mark Zandi, chief economist of Moody's Analytics, said:
The American job machine continues to hum along. Job creation remains strong, with most industries and companies of all sizes adding solidly to their payrolls. The U.S. economy will soon be at full employment.
July 2016 Highlights:
The July 2016 Jobs Report was released by the government's Bureau of Labor Statistics Friday morning, August 5. A good, solid jobs report!

The economy added 151,000 jobs, an average number of new jobs, and the unemployment rate was stable at 4.9%.
From the BLS report:
The change in total nonfarm payroll employment for June was revised down from +292,000 to +271,000, and the change for July was revised up from +255,000 to +275,000. With these revisions, employment gains in June and July combined were 1,000 less than previously reported. Over the past 3 months, job gains have averaged 232,000 per month.
August 2016 reports: (Notation on the links will be changed to "UPDATED for August" when the updated reports become available later today or over the weekend. Not all reports are updated every month.)
More highlights and reports will continue to be posted here over the coming days and weeks. Please check back!
Expectations and the ADP Report:
The pundits were expecting job growth in the vicinity of 180,000 new jobs. The ADP report, which was released Wednesday, August 31st, showed an increase of 177,000 private sector jobs. Over time, the numbers in the ADP report tend to follow those in the BLS government report very closely. In the ADP report, Mark Zandi, chief economist of Moody's Analytics, said:
The American job machine continues to hum along. Job creation remains strong, with most industries and companies of all sizes adding solidly to their payrolls. The U.S. economy will soon be at full employment.
The economy added 255,000 jobs, a large, strong number, which beat estimates of 170,000 to 180,000, and the unemployment rate was stable at 4.9%.
The number of unemployed people went down by13,000 and 407,000 people joined the labor force. Altogether, 420,000 more people started working in July, with 306,000 more people working full-time and150,000 more people working part-time.
There are 217,000 more private sector jobs, and 38,000more government jobs, the largest increase in the number of government jobs in over a year.
From the BLS report:
Job gains occurred in professional and business services, health care, and financial activities. Employment in mining continued to trend down...
The change in total nonfarm payroll employment for May was revised from +11,000 to +24,000, and the change for June was revised from +287,000 to +292,000. With these revisions, employment gains in May and June combined were 18,000 more than previously reported. Over the past 3 months, job gains have averaged 190,000 per month.
(For the record, 8 years ago, in July 2008, we lost 209,000 jobs as the country continued its slide into the worst recession in 80 years.)
July 2016 reports: (As usual, notation on the links will be changed to "UPDATED for July" when the updated reports become available later today or over the weekend. Not all reports are updated every month.)
- What Was the Unemployment Rate When Obama Took Office (compared to today)? Not yet updated
- How Many Jobs Created or Lost Under Obama? - Full-time vs. Part-time? - Updated for July
- Democrats rock at full-time job creation. - Updated for July
- How Many Jobs Were Created in 2016?
- Jobs Lost/Gained Year by Year Since 1999 - Not yet updated.
- 93 Million People Not in the Labor Force? Who are those people? Latest update is for April 2015
March 2016:
The March 2016 Jobs numbers and unemployment reports were released by the Bureau of Labor Statistics at 8:30 Eastern time this morning, April 1st, 2016.
Job gains occurred in professional and business services, health care, and financial activities. Employment in mining continued to trend down...
The change in total nonfarm payroll employment for May was revised from +11,000 to +24,000, and the change for June was revised from +287,000 to +292,000. With these revisions, employment gains in May and June combined were 18,000 more than previously reported. Over the past 3 months, job gains have averaged 190,000 per month.
(For the record, 8 years ago, in July 2008, we lost 209,000 jobs as the country continued its slide into the worst recession in 80 years.)
July 2016 reports: (As usual, notation on the links will be changed to "UPDATED for July" when the updated reports become available later today or over the weekend. Not all reports are updated every month.)
- What Was the Unemployment Rate When Obama Took Office (compared to today)? Not yet updated
- How Many Jobs Created or Lost Under Obama? - Full-time vs. Part-time? - Updated for July
- Democrats rock at full-time job creation. - Updated for July
- How Many Jobs Were Created in 2016?
- Jobs Lost/Gained Year by Year Since 1999 - Not yet updated.
- 93 Million People Not in the Labor Force? Who are those people? Latest update is for April 2015
March highlights:
- Payroll jobs increased by +215,000 and the unemployment rate ticked up slightly to 5.0% as about 400,000 people entered the job market (meaning that they started working or started looking for work). That is a NET number.
- +195,000 new private sector jobs; +20,000 government jobs, almost all in local government but not education.
- Over the past 3 months, job gains have averaged 209,000 per month.
- Also, there are about 1.9 million more people who have entered the job market over the past 4 months, with about 1.9 million more people employed over the past 4 months. This means that people are looking for jobs and finding them.
- The BLS changed their January and February estimates slightly. January numbers were decreased slightly from 172,000 to 168,000 and February numbers were increased slightly from 242,000 to 245,000.
- As a result of more people in the labor force, the labor force participation rate increased very slightly from 62.9% to 63.0%.
- The number of people not in the labor force (people in school, people retired, people home with children, etc.) decreased for the fourth month in a row as people returned to work. It is now 93,482,000.
- The alternate unemployment rate increased very slightly to 9.8% from 9.7%, reflecting the slight increase in the regular (U-3) unemployment rate.
- As mentioned above, the labor force participation rate has been increasing as more people go back to work, and it is now at 63.0%, the highest it has been in about 3 years. Year over year, we have about 2.4 million MORE people in the labor force. Remember that there is NO ideal labor force size, and most of the overall decrease in the labor force participation RATE over the last few years has been due to Baby Boomers retiring in great numbers.
- The overall number of people employed increased by 246,000.
- The number of people working full-time increased by 241,000 last month; the number of people working part-time decreased by about 35,000 last month. There are 2.5 million MORE people working full-time than there were a year ago, and 525,000 MORE people working part-time than a year ago.
The pundits were expecting continued good job growth, in the vicinity of 200,000 new jobs. The ADP report, which was released Wednesday, March 30th, showed an increase of 200,000 private sector jobs. In the ADP report, Mark Zandi made the following comments:
Mark Zandi, chief economist of Moody’s Analytics, said, “The job market continues on its amazing streak. The March job gain of 200,000 is consistent with average monthly job growth of the past more than four years. The only industry reducing payrolls is energy as has been the case for over a year. All indications are that the job machine will remain in high gear.
March 2016 reports: (As usual, notation on the links will be changed to "UPDATED for March" when the updated reports become available later today or over the weekend. Not all reports are updated every month.)
- What Was the Unemployment Rate When Obama Took Office (compared to today)? Not yet published for March.
- How Many Jobs Created or Lost Under Obama? - Full-time vs. Part-time? - Not yet published for March 2015
- How Many Jobs Lost or Gained in March 2016? - Not yet published for March
- Private Sector Job Loss/Growth Since 2008 w/ Graph - Not yet updated for March
- How Many Jobs Have Been Created in 2016? - Not yet updated for March
- Jobs Lost/Gained Year by Year Since 1999 - Not yet updated for March
- How Many People Have Been Fired in 2014 or 2015? Updated with latest numbers through May 2015
- How Many People Left or Joined the Work Force (Civilian Labor Force) Since Obama Took Office? - Not yet updated for March
- 93 Million People Not in the Labor Force? Who are those people? Latest update is for April 2015
- How Many Government Jobs Lost or Added Under Obama? - Not yet updated for March
More highlights and reports will continue to be posted here throughout the day and over the weekend. Please check back!
February 2016:
The February Jobs Reports were released this morning, Friday, March 4. The economy added 242,000 new jobs, a larger number than expected, while the unemployment rate stayed the same at 4.9%.
The pundits were expecting continued good job growth, in the vicinity of 200,000 new jobs. The ADP report, which was released Wednesday, March 30th, showed an increase of 200,000 private sector jobs. In the ADP report, Mark Zandi made the following comments:
Mark Zandi, chief economist of Moody’s Analytics, said, “The job market continues on its amazing streak. The March job gain of 200,000 is consistent with average monthly job growth of the past more than four years. The only industry reducing payrolls is energy as has been the case for over a year. All indications are that the job machine will remain in high gear.
- What Was the Unemployment Rate When Obama Took Office (compared to today)? Not yet published for March.
- How Many Jobs Created or Lost Under Obama? - Full-time vs. Part-time? - Not yet published for March 2015
- How Many Jobs Lost or Gained in March 2016? - Not yet published for March
- Private Sector Job Loss/Growth Since 2008 w/ Graph - Not yet updated for March
- How Many Jobs Have Been Created in 2016? - Not yet updated for March
- Jobs Lost/Gained Year by Year Since 1999 - Not yet updated for March
- How Many People Have Been Fired in 2014 or 2015? Updated with latest numbers through May 2015
- How Many People Left or Joined the Work Force (Civilian Labor Force) Since Obama Took Office? - Not yet updated for March
- 93 Million People Not in the Labor Force? Who are those people? Latest update is for April 2015
- How Many Government Jobs Lost or Added Under Obama? - Not yet updated for March
More highlights and reports will continue to be posted here throughout the day and over the weekend. Please check back!
The number of jobs added was about 50,000 MORE than the expected by the various pundits. We have continued to break records in the streak of months of consecutive job growth, both in the total number of jobs and in the number of private jobs. We now have 72 months of consecutive PRIVATE sector job growth (since Feburary 2010) and 65 months of consecutive TOTAL jobs growth (since September 2010).
Remember that jobs numbers are seasonally adjusted.

From the BLS Employment Situation report:
The change in total nonfarm payroll employment for December was revised from +262,000 to +271,000, and the change for January was revised from +151,000 to +172,000. With these revisions, employment gains in December and January combined were 30,000 more than previously reported. Over the past 3 months, job gains have averaged 228,000 per month.
February Highlights:
- 242,000 total new payroll jobs.
- 230,000 new private sector jobs.
- 12,000 increase in the number of government jobs.
- These numbers are higher than the 190,000 new jobs estimated by the various "pundits".
- The unemployment rate stayed the same at 4.9% as the number of unemployed increased slightly by 24,000 and as the number of people employed increased significantly by 530,000. The number of people in the labor force (people working PLUS people actively looking for work) increased by 555,000.
- The number of people NOT in the labor force (This includes people 16 years of age and older who are in school, retired, home with children, etc.) decreased by 374,000 to 93,688,000 due to the large number of people entering the labor force.
- The labor force participation rate increased by .2% to 62.9% due to the large number of people entering or re-entering the labor force. (This is the highest the labor force participation rate has been for over a year.)
- Year over year, we have about 2,000,000 MORE people in the labor force DESPITE large numbers of Baby Boomers retiring. Remember that there is NO ideal labor force participation rate. Also remember that most of the overall decrease in the labor force participation rate is due to these large numbers of retiring Baby Boomers.
- Alternate unemployment rate declined .2% to 9.7% after staying the same for three months. (This is due mostly to a decrease in the number of "marginally attached" workers, those who say they want a job and have looked in the past year, but did not look for work in the past month. It also includes discouraged workers, a number which has declined by 133,000 or 18% over the past year.)
- The number of people working full-time increased by 65,000 last month.
- The number of people working part-time increased by about 489,000 last month, but most of those people (about 304,000) were working part-time by choice.
- The number of people working part-time INVOLUNTARILY stayed exactly the same and the number of people working part-time VOLUNTARILY INCREASED by 304,000.
- There are 2.4 million MORE people working full-time than there were a year ago, and 440,000 MORE people working part-time than a year ago.
- As mentioned above, the BLS increased the December jobs numbers from +262,000 to +271,000 and increased the January jobs numbers from +151,000 to +172,000. Over the past 3 months, job gains have averaged a very healthy 228,000 per month.
Since Obama took office (January 2009):
- 9.5 million MORE jobs in total
- 10.0 million MORE private sector jobs
- 8.9 million MORE people working
- 7.4 million MORE people working full-time
- 1.5 million MORE people working part-time
- 1.9 million FEWER people working part-time INVOLUNTARILY
Since the "trough" of the recession in late 2009/early 2010:
- 13.8 million MORE jobs in total
- 14.3 million MORE private sector jobs
- 13 million MORE people working
- 12.7 million MORE people working full-time.
- 1.2 million MORE people working part-time.
- 3.3 million FEWER people working part-time INVOLUNTARILY.
February 2016 reports: (As usual, notation on the links will be changed to "UPDATED for February" when the updated reports become available later today or over the weekend. Not all reports are updated every month.)
- What Was the Unemployment Rate When Obama Took Office (compared to today)? Not yet updated
- How Many Jobs Created or Lost Under Obama? - Full-time vs. Part-time? - Updated for FEBRUARY 2016
- How Many Jobs Lost or Gained in February 2015? - Not yet published.
- Private Sector Job Loss/Growth Since 2008 w/ Graph - Not yet updated.
- How Many Jobs Were Created in 2015? - Not yet finalized.
- Jobs Lost/Gained Year by Year Since 1999 - Not yet updated.
- How Many People Have Been Fired in 2014 or 2015? Updated with numbers through May 2015
- How Many People Left or Joined the Work Force (Civilian Labor Force) Since Obama Took Office? - Not yet updated.
- 93 Million People Not in the Labor Force? Who are those people? Latest update is for April 2015
- How Many Government Jobs Lost or Added Under Obama? - Not yet updated.
November 2015:
The November Jobs Reports were released this morning, Friday, December 4. The numbers are about what was expected; decent jobs numbers but not exceptional. They almost surely mean that the Federal Reserve will raise interest rates at its next meeting in December.

November Highlights:
- 211,000 total new payroll jobs; 197,000 new private sector jobs; 14,000 increase in the number of government jobs. These numbers are very close to the 200,000 jobs that the pundits and prognosticators predicted.
- If there is a concern in this report, it is the increase in the number of people working part-time because they can't find full-time work. However, this number is volatile and may well decline next month, as it has generally for the past 4-5 years. Full-time/part-time breakdown will be available HERE later today.
- The BLS increased both the September and October estimates. September numbers were increased slightly by 8,000 from +137,000 to +145,000, and the October estimate was increased by 27,000 from +271,000 to +298,000. From the BLS: "With these revisions, employment gains in September and October combined were 35,000 more than previously reported. Over the past 3 months, job gains have averaged 218,000 per month."
- The unemployment rate stayed exactly the same at 5.0% as the number of unemployed increased slightly by 29,000 and as the number of people employed increased by 244,000.
- The number of people not in the labor force (people 16 years of age and older who are in school, retired, e home with children, etc.) decreased slightly to 94,446,000.
- Alternate unemployment rate increased slightly from 9.8% to 9.9%. That decline primarily reflected an increase of about 300,000 in the number of people who were working part-time "involuntarily" because they couldn't find full-time jobs. (That number has declined by 800,000 over the past year and about 1,629,000 over the past two years.)
- As mentioned above, the labor force participation rate increased slightly to 62.5%. The labor force participation rate has been between 62.4% and 62.6% for the past five months. Year over year, we have about 900,000 MORE people in the labor force DESPITE large numbers of Baby Boomers retiring. Remember that there is NO ideal labor force participation rate and most of the ongoing decrease in the labor force participation rate is due to these large numbers of retiring Baby Boomers.
- The overall number of people employed increased by 244,000.
- The number of people working full-time increased by 3,000 last month; the number of people working part-time increased by about 137,000 last month. The number of people working part-time INVOLUNTARILY increased by 319,000 and the number of people working part-time VOLUNTARILY decreased by 12,000. There are 2.5 million MORE people working full-time than there were a year ago, and 455,000 FEWER people working part-time than a year ago.
MORE TO COME.....
November 2015 reports: (As usual, notation on the links will be changed to "UPDATED for November" when the updated reports become available. Not all reports are updated every month.)
- What Was the Unemployment Rate When Obama Took Office (compared to today)? NOVEMBER!
- How Many Jobs Created or Lost Under Obama? - Full-time vs. Part-time? - NOVEMBER 2015
- How Many Jobs Lost or Gained in November 2015? - Not yet published for November
- Private Sector Job Loss/Growth Since 2008 w/ Graph - Not yet updated for November
- How Many Jobs Have Been Created in 2015? - NOVEMBER!
- How Many Jobs Have Been Created in 2014? - LATEST REVISIONS INCLUDED
- Jobs Lost/Gained Year by Year Since 1999 - Not yet updated for November
- How Many People Have Been Fired in 2014 or 2015? Updated with latest numbers through May 2015
- How Many People Left or Joined the Work Force (Civilian Labor Force) Since Obama Took Office? - Not yet updated for November
- 93 Million People Not in the Labor Force? Who are those people? Latest update is for April 2015
- How Many Government Jobs Lost or Added Under Obama? - Not yet updated for November
October 2015:
The October Jobs Reports were released Friday morning, November 6. These are the best jobs numbers in several months, meaning that the Federal Reserve is more likely to raise interest rates at its next meeting in December.

November Highlights:
MORE TO COME.....
November 2015 reports: (As usual, notation on the links will be changed to "UPDATED for November" when the updated reports become available. Not all reports are updated every month.)
- What Was the Unemployment Rate When Obama Took Office (compared to today)? NOVEMBER!
- How Many Jobs Created or Lost Under Obama? - Full-time vs. Part-time? - NOVEMBER 2015
- How Many Jobs Lost or Gained in November 2015? - Not yet published for November
- Private Sector Job Loss/Growth Since 2008 w/ Graph - Not yet updated for November
- How Many Jobs Have Been Created in 2015? - NOVEMBER!
- How Many Jobs Have Been Created in 2014? - LATEST REVISIONS INCLUDED
- Jobs Lost/Gained Year by Year Since 1999 - Not yet updated for November
- How Many People Have Been Fired in 2014 or 2015? Updated with latest numbers through May 2015
- How Many People Left or Joined the Work Force (Civilian Labor Force) Since Obama Took Office? - Not yet updated for November
- 93 Million People Not in the Labor Force? Who are those people? Latest update is for April 2015
- How Many Government Jobs Lost or Added Under Obama? - Not yet updated for November
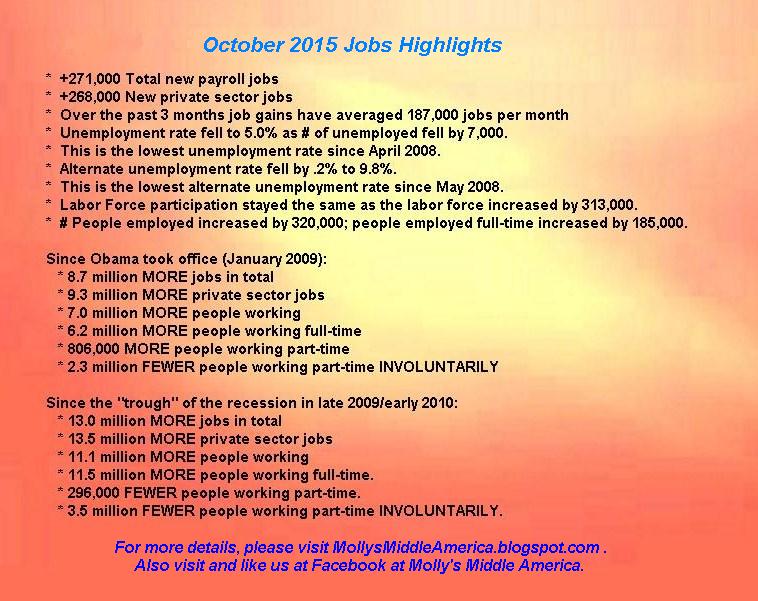
October Highlights:
- 271,000 total new payroll jobs; 268,000 new private sector jobs; a small 3,000 increase in the number of government jobs.) These numbers are much higher than the 180,000 jobs that the pundits and prognosticators predicted. Full-time/part-time breakdown will be available HERE later today.) This is a welcome increase after the last two months of anemic job growth, and the numbers mark a return to the job growth that was typical earlier this summer.
- The BLS changed their August and September estimates slightly. August numbers were increased by 17,000 from +136,000 to +153,000, and the September estimate was decreased slightly from +142,000 to +137,000. From the BLS: "With these revisions, employment gains in August and September combined were 12,000 more than previously reported. Over the past 3 months, job gains have averaged 187,000 per month. "
- The unemployment rate declined slightly to 5.0% as the number of unemployed decreased slightly by 7,000 and as the number of people employed increased by 320,000, and as 313,000 people entered the labor force.
- We now have 7,908,000 officially unemployed, the lowest number of unemployed since April 2008, 7 1/2 years ago. As a result of more people in the labor force, the labor force participation rate increased very slightly from 62.36% to 62.43%.
- The number of people not in the labor force (people in school, people retired, people home with children, etc.) decreased slightly to 94,513,000.
- Alternate unemployment rate fell from 10.0% to 9.8%. That decline primarily reflected a decrease in the number of people who were working part-time "involuntarily" because they couldn't find full-time jobs. (That number has declined by 1,200,000 over the past two years.)
- As mentioned above, the labor force participation rate is stable at 62.4%. The labor force participation rate has been under 62.5% for the past two months after being at 62.5% for the three prior months. Year over year, we have about 800,000 MORE people in the labor force.
- Remember that there is NO ideal labor force size and most of the ongoing decrease in the labor force participation rate is due to Baby Boomers retiring in great numbers.
- The overall number of people employed increased by 320,000.
- The number of people working full-time increased by 185,000 last month; the number of people working part-time increased by about 214,000 last month. However, the number of people working part-time INVOLUNTARILY declined by 269,000 and the number of people working part-time VOLUNTARILY increased by 483,000.
- There are 2.3 million MORE people working full-time than there were a year ago, and 507,000 FEWER people working part-time than a year ago.
- Altogether, 2,062,000 payroll jobs have been ADDED in 2015 year to date. That's an additional 206,000 jobs per month in 2015.
- 1,976,000 private payroll sector jobs have been ADDED in 2015 year to date. That's an additional 197,600 private jobs per month in 2015.
October 2015 reports: (As usual, notation on the links will be changed to "UPDATED for October" when the updated reports become available. Not all reports are updated every month.)
- What Was the Unemployment Rate When Obama Took Office (compared to today)? Published for October
- How Many Jobs Created or Lost Under Obama? - Full-time vs. Part-time? - Published for October 2015
- How Many Jobs Lost or Gained in October 2015? - Not yet published for October
- Private Sector Job Loss/Growth Since 2008 w/ Graph - Not yet updated for October
- How Many Jobs Have Been Created in 2015? - Updated for October
- How Many Jobs Have Been Created in 2014? - LATEST REVISIONS INCLUDED
- Jobs Lost/Gained Year by Year Since 1999 - Not yet updated for October
- How Many People Have Been Fired in 2014 or 2015? Updated with latest numbers through May 2015
- How Many People Left or Joined the Work Force (Civilian Labor Force) Since Obama Took Office? - Not yet updated for October
- 93 Million People Not in the Labor Force? Who are those people? Latest update is for April 2015
- How Many Government Jobs Lost or Added Under Obama? - Not yet updated for October
August 2015 Highlights:

August numbers:
- 173,000 total new payroll jobs; 140,000 new private sector jobs; a 33,000 increase in the number of government jobs.) These numbers are less than what the pundits and prognosticators predicted, probably due to uncertainty in the markets and uncertainty over China. This is a fairly low number of private sector jobs, and a relatively high number of new government jobs.
(Full-time/part-time breakdown will be available HERE later today.) - The BLS increased its June estimate from +231,000 to +245,000, and the July estimate was revised from +215,000 to +245,000. "With these revisions, employment gains in June and July combined were 44,000 more than previously reported. Over the past 3 months, job gains have averaged 221,000 per month."
- The unemployment rate declined to 5.1% as the number of unemployed decreased by a large 237,000. We now have 8,029,000 officially unemployed, the lowest number of unemployed since early 2008, over 7 years ago. The size of the labor force stayed almost exactly the same, with a minor decrease of 41,000.
- Alternate unemployment rate fell from 10.4% down to 10.3%. That decrease reflected a decrease in the number of people who were not looking for work because they were discouraged, a decrease in the number of people who were working part-time involuntarily because they couldn't find full-time jobs, and a decrease in the number of people who are "marginally attached" to the labor force, meaning they want a job, had looked recently, but couldn't look due to illness, childcare issues, transportation issues, or because they were in school.
- Labor force participation rate stayed the same at 62.6%. The number of people in the labor force decreased slightly by 41,000. Year over year, we have about 1.1 million MORE people in the labor force. Remember that there is NO ideal labor force size.
- The overall number of people employed increased by 196,000.
- The number of people working full-time increased by 435,000 last month; the number of people working part-time decreased by about 349,000 last month. The percentage of people working full-time continues to climb, now at its highest level since late 2008. Year over year, we have about 3.3 million MORE people working full-time and 800,000 FEWER people working part-time.
Since the "trough" of the recession in late 2009/early 2010 in seasonally adjusted numbers:
- 12,639,000 MORE payroll jobs in total
- 13,120,000 MORE private sector jobs
- 11,023,000 MORE people working (includes self-employed and agricultural workers)
- 11,465,000 MORE people working full-time.
- 563,000 FEWER people working part-time.
- 2,750,000 FEWER people are working part-time involuntarily.
Since Bush left office & Obama took office (January 2009) in seasonally adjusted numbers:
- 8,311,000 MORE jobs in total
- 8,895,000 MORE private sector jobs
- 6,884,000 MORE people working
- 6,206,000 MORE people working full-time
- 539,000 MORE people working part-time
- 1,563,000 FEWER people working part-time INVOLUNTARILY (because they couldn't find a full-time job.)
- About 750,000 MORE people are working part-time voluntarily.. because they WANT to work part-time... since Obama was inaugurated.
August 2015 reports: (As usual, notation on the links will be changed to "UPDATED for August" when the updated reports become available. Not all reports are updated every month.)
- What Was the Unemployment Rate When Obama Took Office (compared to today)? Published for AUGUST 2015
- How Many Jobs Created or Lost Under Obama? - Full-time vs. Part-time? - Published for AUGUST 2015
- How Many Jobs Lost or Gained in August 2015? - Not yet published for AUGUST
- Private Sector Job Loss/Growth Since 2008 w/ Graph - Not yet updated for August
- How Many Jobs Have Been Created in 2015? - Not yet updated for AUGUST
- How Many Jobs Have Been Created in 2014? - LATEST REVISIONS INCLUDED
- Jobs Lost/Gained Year by Year Since 1999 - Not yet updated for August
- How Many People Have Been Fired in 2014 or 2015? Updated with latest numbers through May 2015
- How Many People Left or Joined the Work Force (Civilian Labor Force) Since Obama Took Office? - Not yet updated for August
- 93 Million People Not in the Labor Force? Who are those people? Latest update is for April 2015
- How Many Government Jobs Lost or Added Under Obama? - Not yet updated for August
Preview (written before the BLS released the above report):
The "pundits" are still expecting an additional 220,000 jobs when the numbers are announced in the next hour, but there is some uncertainty. Job openings in August were off the pace of May and June, and the craziness in the stock market has let to confusion and concern. First time unemployment claims numbers are still very, very low, but they aren't quite as low as they were in late July.
The "pundits" are still expecting an additional 220,000 jobs when the numbers are announced in the next hour, but there is some uncertainty. Job openings in August were off the pace of May and June, and the craziness in the stock market has let to confusion and concern. First time unemployment claims numbers are still very, very low, but they aren't quite as low as they were in late July.
July 2015 Highlights:

- +215,000 total new payroll jobs; +210,000 new private sector jobs; a 5,000 increase in the number of government jobs.) These numbers are slightly less than what the pundits and prognosticators predicted.
- The BLS increased its May estimate slightly to 260,000 from 254,000 and it increased its June estimate slightly from 221,000 to 231,000.
- The unemployment rate stayed the same at 5.3% as the number of unemployed stayed virtually the same at 8,266,000 (from 8,299,000 in June), continuing to hit new lows since the big recession began in 2007-2008 when we had a much smaller labor force.
- Alternate unemployment rate fell from 10.5% down to 10.4%. That decrease reflected a decrease in the number of people who were unemployed more than 15 weeks and a decrease in the number of people who were working part-time involuntarily because they couldn't find full-time jobs.
- Labor force participation rate stayed the same at 62.6%. The number of people in the labor force increased slightly by 69,000. Year over year, we have about 1.1 million MORE people in the labor force.
Remember that there is NO ideal labor force size.
Actually, inflation-adjusted wages have tended to go up when the labor force participation rate goes down--- Just something to think about if you are one of the many who has been bulldozed by the "Labor force percentage.. .yada, yada, yada..." crowd. More HERE about the labor force percentage. - The reported number of people employed increased by 101,000, the reported number of people unemployed decreased by 33,000.
- The number of people working full-time increased by 536,000 last month; the number of people working part-time decreased by about 402,000 last month. Year over year, we have about 3.1 million MORE people working full-time and 700,000 FEWER people working part-time.Since the "trough" of the recession in late 2009/early 2010 in seasonally adjusted numbers:
- 12.4 million MORE jobs in total
- 13.0 million MORE private sector jobs
- 10.8 million MORE people working
- 11 million MORE people working full-time.
- 200,000 MORE people working part-time.
- (Yes, despite what you may have heard, from the depth of the recession until now, we have many more additional people working full-time vs. people working part-time jobs. When a recession hits, companies generally cut back on full-time workers first. When companies start hiring again, the number of full-time workers increases.)
- Since Bush left office & Obama took office (January 2009) in seasonally adjusted numbers:
- 8.1 million MORE jobs in total
- 8.8 million MORE private sector jobs
- 6.7 million MORE people working
- 5.8 million MORE people working full-time
- 200,000 FEWER people working part-time
July 2015 reports: (As usual, notation on the links will be changed to "UPDATED for JULY" when the updated reports become available. Not all reports are updated every month.)
- What Was the Unemployment Rate When Obama Took Office (compared to today)? Not yet published for JULY 2015
- How Many Jobs Created or Lost Under Obama? - Full-time vs. Part-time? - Published for JULY 2015
- How Many Jobs Lost or Gained in July 2015? - Not yet published for JULY
- Private Sector Job Loss/Growth Since 2008 w/ Graph - Not yet updated for July
- How Many Jobs Have Been Created in 2015? - Not yet updated for JULY
- How Many Jobs Have Been Created in 2014? - LATEST REVISIONS INCLUDED
- Jobs Lost/Gained Year by Year Since 1999 - not yet updated for July
- How Many People Have Been Fired in 2014 or 2015? Updated with latest numbers through May 2015
- How Many People Left or Joined the Work Force (Civilian Labor Force) Since Obama Took Office? - not yet updated for July
- 93 Million People Not in the Labor Force? Who are those people? Latest update is for April 2015
- How Many Government Jobs Lost or Added Under Obama? - not yet updated for July
July 2015 Jobs Numbers Preview as of Thursday night, August 6:
This will be a short preview as I did spend quite a bit of time watching the Republican debates this evening. The pundits and prognosticators are predicting decent, but not blockbuster, jobs numbers for July when the BLS releases that report tomorrow morning, Friday, August 7, at 8:30 a.m. Eastern time.
See you all in the morning!
1. Reuters: Reuters conducts a survey of economists and reports the consensus:.
The number of U.S. jobs probably rose at a healthy pace in July and wages likely rebounded in data due on Friday, providing further signs of an improving economy that could allow the Federal Reserve to raise interest rates in September.
A Reuters survey of economists forecast U.S. nonfarm payrolls increased by 223,000 last month, matching June's job gains, a number which would be slightly above the monthly average for the first half of the year.
Though the pace of hiring has slowed from last year, it remains double the rate needed to keep up with population growth. The Labor Department will release its closely watched employment report on Friday at 8:30 a.m.
The unemployment rate is forecast to hold steady at a seven-year low of 5.3 percent, near the 5.0 percent to 5.2 percent range most Fed officials think is consistent with a steady but low level of inflation.
2. ADP: The private payroller ADP's report, which usually precedes the BLS report by two days, was disappointing. ADP estimated that only 185,000 more private-sector jobs were created in July 2015. ADP estimated increases in all sectors, with the fattest increase in professional and business services.
3. The June Consumer Sentiment index compiled by the University of Michigan showed a decline from 96.1 in June to 93.1 in July. However, the Sentiment Index has increased 14% over the past year.
Consumer confidence slipped a bit in the July 2015 survey. A disappointing pace of economic growth was the main reason for the small decline in consumer confidence. Nonetheless, the data provide no indication of a break in the prevailing positive trend. Indeed, the Sentiment Index has averaged 94.5 since December 2014, the highest eight month average since 2004. Although one-in-ten consumers, when asked to identify any recent economic developments they had heard, referred negatively to Greece, the Chinese economy, and the Trans-Pacific Partnership on trade, it had virtually no impact on the Sentiment Index. The maintenance of confidence at high levels during the past eight months has been mainly due to modestly positive news on jobs and wages.
4. The jobs report by the search engine Linkup.com was higher than the other projections. A lot of information in that report; if you are a numbers geek, you may find a side trip over to the Link up blog very interesting indeed:
Based on the 11% and 17% increases in job openings on LinkUp in May and June respectively, we are forecasting a strong jobs report for Friday with a net gain of 310,000 jobs.
5. Finally, the number of Americans filing new claims for unemployment benefits AND the number of Americans filing for continuing benefits continue to be very, very low. The unadjusted number of new claims for the week ending August 1st was the LOWEST number of new claims since... late 1973.... when we had many fewer people working. Wow. You can see more here at the Department of Labor's site.
June 2015 Highlights:
- +223,000 total new payroll jobs; +223,000 new private sector jobs. (No increase in the number of government jobs.) These numbers are slightly less than what the pundits and prognosticators predicted.
- The BLS decreased its April and May estimates. April had been estimated at 221,000 and was revised downwards to 187,000. May had been estimated at 280,000; that was revised down to 254,000. Still good numbers, and revisions have generally been going up not down so a few months of downward revisions are fairly meaningless.
- Unemployment rate decreased a whopping .2% down to 5.3% as the number of unemployed declined to 8.3 million, the lowest it has been since early 2008 when we had a much smaller labor force.
- Alternate unemployment rate fell from 10.8% down to 10.5%. That's a big decrease. We'll have to see which components contributed to the decline. More on that later.
- Labor force participation rate decreased .3%. The number of people in the labor force decreased by a big 432,000. This could reflect more people retiring in June (teachers in particular) than was estimated. We always have people leaving the work force in June as their teaching jobs end, and many retire in June. But seasonal adjustments are supposed to account for that; sometimes they don't quite hit it. (See my labor force analysis HERE.) Many people go a bit crazy when they see the number of people in the labor force decline; but this is a volatile number and needs to be looked at year over year, not month over month. Year over year, we have about 1.3 million MORE people in the labor force.
- The reported number of people employed was essentially the same, a decrease of 56,000, the reported number of people unemployed decreased by 375,000.
- The number of people working full-time declined by 349,000 last month, but this is also a volatile number, affected by the number of teachers leaving in June, the number of people getting summer jobs, etc. This is a nother number that needs to be looked at year over year, not month over month. Year over year, we have about 2.8 million MORE people working full-time and 330,000 FEWER people working part-time.
Since the "trough" of the recession in late 2009/early 2010 in seasonally adjusted numbers:
- 12.2 million MORE jobs in total
- 12.8 million MORE private sector jobs
- 10.7 million MORE people working
- 10.5 million MORE people working full-time.
- 188,000 MORE people working part-time.
- (Yes, despite what you may have heard, from the depth of the recession until now, we have many more additional people working full-time vs. people working part-time jobs. When a recession hits, companies generally cut back on full-time workers first. When companies start hiring again, the number of full-time workers increases.)
Since Bush left office & Obama took office (January 2009) in seasonally adjusted numbers:
- 7.9 million MORE jobs in total
- 8.5 million MORE private sector jobs
- 6.6 million MORE people working
- 5.2 million MORE people working full-time
- 1.3 million MORE people working part-time

June 2015 reports: (Notation on the links will be changed to "UPDATED for JUNE" when the updated reports become available.)
- What Was the Unemployment Rate When Obama Took Office (compared to today)? Published for JUNE 2015
- How Many Jobs Created or Lost Under Obama? - Full-time vs. Part-time? - Published for JUNE 2015
- How Many Jobs Lost or Gained in June 2015? - PUBLISHED for June
- Private Sector Job Loss/Growth Since 2008 w/ Graph - Not yet updated for June
- How Many Jobs Have Been Created in 2015? - UPDATED for June
- How Many Jobs Have Been Created in 2014? - LATEST REVISIONS INCLUDED
- Jobs Lost/Gained Year by Year Since 1999 - not yet updated for June
- How Many People Have Been Fired in 2014? Updated with latest 2014 numbers
- Private Sector Job Loss/Growth Since 2008 w/ Graph - Not yet updated for June
- How Many People Left or Joined the Work Force (Civilian Labor Force) Since Obama Took Office? - not yet updated for June
- 93 Million People Not in the Labor Force? Who are those people? Latest update is for April 2015
- How Many Government Jobs Lost or Added Under Obama? - not yet updated for June
May 2015 updates...
The pundits were a bit short on new jobs when they contemplated May. A whopping 280,000 new jobs were added in May, many more than the 226,000 anticipated.
The unemployment rate crept up to 5.5% as about 400,000 people entered the labor force. At first glance, there is NOTHING NEGATIVE in this jobs report. Very bullish, very positive numbers.
The unemployment rate crept up to 5.5% as about 400,000 people entered the labor force. At first glance, there is NOTHING NEGATIVE in this jobs report. Very bullish, very positive numbers.
If there are many more jobs, as there were in May 2015, but the unemployment rate stays the same or goes up a tenth, as it did in May 2015, this would be a good indication that more people have entered the labor force in May. This was certainly true in May, as 397,000 people ENTERED the civilian labor force, the largest increase in five months.
There was much concern back in March when the number of jobs added was very low. I suggested that the less-than-expected increase in the number of jobs may have reflected companies having a harder time filling positions in February and into March: It was colder and people may have stayed out of the winter job market a bit longer than usual. I suggested that we would see a rebound in the next months, and the low numbers in March were not a reason to be concerned. I remain convinced that I was right. May 2015 Highlights (Specific reports listed below):
- +280,000 total new payroll jobs; +262,000 new private sector jobs. These increases are a bit larger than the consensus of the "pundits", who estimated that we would add about 226,000 jobs in May.
- "The change in total nonfarm payroll employment for March was revised from +85,000 to +119,000, and the change for April was revised from +223,000 to +221,000. With these revisions, employment gains in March and April combined were 32,000 more than previously reported.
- Over the past 3 months, job gains have averaged 207,000 per month.
- Unemployment rate increased slightly by .1% to 5.5% as about 397,000 people entered the labor force and started to look for work.
- Alternate unemployment rate stayed the same at 10.8% as the numbers of discouraged and marginally attched workers fell and the number of involuntary part-time workers increased slightly.
- Labor force participation rate increased .1%. The number of people in the labor force increased by 397,000. The reported number of people employed increased by 272,000, the reported number of people unemployed increased by 125,000.
- Number of people working full-time increased by about 630,000 while number of people working part-time decreased by about 232,000. That's 2,612,000 MORE people working full-time over the past year, since May 2014, and 296,000 MORE people working part-time over the past year.
- The number of involuntary part-time workers (people working part-time because they couldn't find full-time work) increased by 72,000 in May, and it has declined 616,000 over the past year, since May 2015.
- The number of long-term unemployed (people looking for work over half a year) dropped by 23,000 in May, and has dropped 849,000 over the past year, since May 2014.
Since the "trough" of the recession in late 2009/early 2010 in seasonally adjusted numbers:
- 12.0 million MORE jobs in total
- 12.6 million MORE private sector jobs
- 10.8 million MORE people working
- 10.8 million MORE people working full-time.
- 27,000 FEWER people working part-time.
- (Yes, despite what you may have heard, from the depth of the recession until now, we have many more additional people working full-time vs. part-time jobs. When a recession hits, companies generally cut back on full-time workers first. When companies start hiring again, the number of full-time workers increases.)
Since Bush left office & Obama took office (January 2009) in seasonally adjusted numbers:
- 7.7 million MORE jobs in total
- 8.3 million MORE private sector jobs
- 6.6 million MORE people working
- 5.6 million MORE people working full-time
- 1.1 million MORE people working part-time
May 2015 reports: (Notation on the links will be changed to "UPDATED for MAY" when the updated reports become available.)
- What Was the Unemployment Rate When Obama Took Office (compared to today)?
- How Many Jobs Created or Lost Under Obama? - Full-time vs. Part-time? Published for MAY
- How Many Jobs Lost or Gained in May 2015?
- Private Sector Job Loss/Growth Since 2008 w/ Graph
- How Many Jobs Have Been Created in 2015? Updated for MAY
- How Many Jobs Have Been Created in 2014? - LATEST REVISIONS INCLUDED
- Jobs Lost/Gained Year by Year Since 1999
- How Many People Have Been Fired in 2014? Updated with 2014 numbers
- How Many People Left or Joined the Work Force (Civilian Labor Force) Since Obama Took Office?
- 93 Million People Not in the Labor Force? Who are those people? Latest update is for April 2015
- How Many Government Jobs Lost or Added Under Obama?
April 2015 updates...
The pundits redeemed themselves this month.
The pundits redeemed themselves this month.
The "pundits" expected 224,000 new jobs in April.. and they came very close with the BLS reporting 223,000 new jobs with 213,000 of those jobs in the private sector. The March numbers, however, were worse than initially reported, as the 126,000 new jobs mentioned last month were reduced to only 85,000 new jobs. Unemployment dipped to 5.4% (from 5.5%).

The "pundits" are also saying that the rebounding jobs numbers show that employers are confident enough, even after a bit of stagnation earlier in the year, to keep hiring.
I felt that March's poor showing, in view of rock bottom initial unemployment claims and high numbers of job openings in early 2015, might have been attributable to employers actually having a harder time filling positions in February and into March: It was colder and people may have stayed out of the winter job market a bit longer than usual. Remember that job numbers are reported as of the second week of the month, and it takes several weeks to get new hires on board. It's possible that I was actually right about this, as unemployment claims continue to be very low and we did see an uptick in labor participation this month. As usual, one month up or down does NOT make a trend, and we will all have to wait and see.
Let's remember that we are STILL not where we want to be in terms of jobs. We still have about 1.7 active jobseekers for every job opening out there compared to 1.1 active jobseekers per job opening in December 2000. This is one of the reasons that so many people still feel they are hurting in this economy. The labor market just did not do that well in the early 2000's and we're still trying to make up for that.
April 2015 Highlights (Specific reports listed below):
- +223,000 total new payroll jobs; +213,000 new private sector jobs. These increases are very close to projections of +224,000 jobs in April.
- The BLS decreased its March estimates from +126,000 jobs down to +85,000 jobs.
- The unemployment rate ticked down to 5.4% as the number of unemployed declined slightly.
- Alternate unemployment rate fell from 10.9% down to 10.8%.
- Labor force participation rate edged up by .1% as the number of people in the labor force increased by 106,000. The self-reported number of people employed (which includes farm workers and the self-employed) increased by 192,000 in April.
- Number of people working full-time decreased by about 252,000 while number of people working part-time increased by about 437,000. Despite this month's decrease in full-time workers, there are still 2,314,000 MORE people working full-time over the past year, since April 2014, and 487,000 MORE people working part-time over the past year.
- The number of involuntary part-time workers (people working part-time because they couldn't find full-time work) decreased by 125,000 in April. This number has declined 880,000 over the past year, since April 2014. This also means that this month's increase in part-time workers was due to VOLUNTARY part-time workers; that is, people who PREFERRED to work part-time.
- The number of long-term unemployed (people looking for work over half a year) dropped by 125,000 in April, and has dropped 880,000 over the past year, since April 2014.
Since the "trough" of the recession in late 2009/early 2010 in seasonally adjusted numbers:
- 11.7 million MORE jobs in total
- 12.3 million MORE private sector jobs
- 10.5 million MORE people working
- 10.2 million MORE people working full-time.
- 259,000 MORE people working part-time.
- (Yes, despite what you may have heard, from the depth of the recession until now, we have many more additional people working full-time vs. part-time jobs. When a recession hits, companies generally cut back on full-time workers first. When companies start hiring again, the number of full-time workers increases.)
Since Bush left office & Obama took office (January 2009) in seasonally adjusted numbers:
- 7.4 million MORE jobs in total
- 8.1 million MORE private sector jobs
- 6.4 million MORE people working
- 5.0 million MORE people working full-time
- 1.4 million MORE people working part-time
April 2015 reports: (Notation on the links will be changed to "UPDATED for APRIL" when the updated reports become available.)
- What Was the Unemployment Rate When Obama Took Office (compared to today)? Updated for APRIL
- How Many Jobs Created or Lost Under Obama? - Full-time vs. Part-time? Updated for APRIL
- How Many Jobs Lost or Gained in April 2015?
- Private Sector Job Loss/Growth Since 2008 w/ Graph
- How Many Jobs Have Been Created in 2015? Updated for APRIL
- How Many Jobs Have Been Created in 2014? - LATEST REVISIONS INCLUDED
- Jobs Lost/Gained Year by Year Since 1999
- How Many People Have Been Fired in 2014? Updated with 2014 numbers
- Private Sector Job Loss/Growth Since 2008 w/ Graph
- How Many People Left or Joined the Work Force (Civilian Labor Force) Since Obama Took Office?
- 93 Million People Not in the Labor Force? Who are those people? Latest update is for the end of 2014
- How Many Government Jobs Lost or Added Under Obama?
Well, the pundits got this one wrong, wrong, wrong.
After months of 200,000+ jobs gains, March was very weak, with the Bureau of Labor Statistics estimating only 126,000 new jobs in total, 129,000 new private sector jobs. These numbers were half of what the economic pundits expected (see the previews below), and these were the lowest new jobs numbers in months. We have to go back all the way to December 2013 to find a lower new jobs number.
**********************************************************************March 2015 numbers were released Friday morning, April 3, at 8:30 Eastern time.
See bottom for index of reports.
*********************************************************************
So what does this mean? Perhaps nothing. An anomaly of one month when dealing with numbers as large as those of the United States jobs market is not unusual. That's why numbers are considered "preliminary" and are sometimes corrected months after the initial report. But the booming increases of January and February were also cut back a bit, by about .03%, or 3 hundredths of a percent of the total jobs market, so who knows? We won't know whether this means anything for at least another month.
We know that initial unemployment claims are at the lowest levels they have been for years, since the early 2000's. We know that numbers of job openings are high, the highest they have been since the early 2000's. We also know that the number of unemployed dropped. It is possible that the less-than-expected increase in the number of jobs may reflect companies having a harder time filling positions in February and into March: It was colder and people may have stayed out of the winter job market a bit longer than usual. Remember that job numbers are reported as of the second week of the month, and it takes several weeks to get new hires on board. So we'll all just have to wait and see.
I'm still crunching numbers here and looking at spreadsheets, so check back over the next week for more graphs, charts, highlights, and updates.
March 2015 Highlights (Specific reports listed below):
- +126,000 total new payroll jobs; +129,000 new private sector jobs. These small increases are much lower than the consensus of the "pundits", who estimated that we would add about 245,000 jobs in March.
- The BLS decreased its January estimates, originally at +257,000 new jobs, again. They were decreased to +239,000 last month and now down to +201,000 new jobs in January. The BLS also decreased its February estimates from the initial +295,000 down to +264,000.
- Unemployment rate stayed the same at 5.5% as the number of unemployed declined.
- Alternate unemployment rate fell from 11.0% down to 10.9%.
- Labor force participation rate decreased .1%. The number of people in the labor force decreased by 96,000. The reported number of people employed increased by 34,000, the reported number of people unemployed decreased by 130,000.
- Number of people working full-time increased by about 190,000 while number of people working part-time decreased by about 170,000. That's 2,962,000 MORE people working full-time over the past year, since March 2014, and 364,000 FEWER people working part-time over the past year.
- The number of involuntary part-time workers (people working part-time because they couldn't find full-time work) increased by 75,000 in March, but it has declined 744,000 over the past year, since March 2014.
- The number of long-term unemployed (people looking for work over half a year) dropped by 146,000 in March, and has dropped 1,119,000 over the past year, since March 2014.
Since the "trough" of the recession in late 2009/early 2010 in seasonally adjusted numbers:
- 11.5 million MORE jobs in total
- 12.1 million MORE private sector jobs
- 10.3 million MORE people working
- 10.5 million MORE people working full-time.
- 178,000 FEWER people working part-time.
- (Yes, despite what you may have heard, from the depth of the recession until now, we have many more additional people working full-time vs. part-time jobs. When a recession hits, companies generally cut back on full-time workers first. When companies start hiring again, the number of full-time workers increases.)
Since Bush left office & Obama took office (January 2009) in seasonally adjusted numbers:
- 7.2 million MORE jobs in total
- 7.9 million MORE private sector jobs
- 6.2 million MORE people working
- 5.2 million MORE people working full-time
- 924,000 million MORE people working part-time
March 2015 reports: (Notation on the links will be changed to "UPDATED for MARCH" when the updated reports become available.)
- What Was the Unemployment Rate When Obama Took Office (compared to today)? - UPDATED for March
- How Many Jobs Created or Lost Under Obama? - Full-time vs. Part-time? UPDATED for March 2015
- How Many Jobs Lost or Gained in March 2015? - Published for March
- How Many Jobs Have Been Created in 2015? - Published for March
- How Many Jobs Have Been Created in 2014? LATEST REVISIONS INCLUDED
- Jobs Lost/Gained Year by Year Since 1999 - not yet updated for March
- How Many People Have Been Fired in 2014? Updated with 2014 numbers
- Private Sector Job Loss/Growth Since 2008 w/ Graph - UPDATED for March 2015
- How Many People Left or Joined the Work Force (Civilian Labor Force) Since Obama Took Office? - not yet updated
- 93 Million People Not in the Labor Force? Who are those people? Latest update is for the end of 2014
- How Many Government Jobs Lost or Added Under Obama? - not yet updated
February 2015 Highlights (Specific reports listed below):
- +295,000 total new payroll jobs; +288,000 new private sector jobs. These large increases are again higher than the concensus of the "pundits", who estimated that we would add about 230,000 jobs in February.
- The BLS decreased its January estimates from +257,000 new jobs to +239,000 new jobs; December estimates stayed the same.
- Unemployment rate decreased by .2% (two tenths of a percent) to 5.5%. This decrease was due largely to a big decrease in the number of people who are unemployed.
- Alternate unemployment rate fell from 11.3% down to 11.0%. This was due to a decrease in ALL segments that compose the alternate unemployment rate, particularly the overall number of unemployed and the number of involuntarily part-time workers.
- Labor force participation rate decreased .1%. The number of people in the labor force decreased by 178,000. The reported number of people employed increased by 96,000, the reported number of people unemployed decreased by 274,000.
- Number of people working full-time increased by about 123,000 while number of people working part-time decreased by about 75,000. That's 2,975,000 MORE people working full-time over the past year, since February 2014, and 89,000 MORE people working part-time over the past year. The percentage of all employed people who are working full-time is HIGHER than it has been since the end of 2008.
- The number of involuntary part-time workers (people working part-time because they couldn't find full-time work) decreased by 175,000 in February and dropped 569,000 over the past year, since February 2014.
- The number of long-term unemployed (people looking for work over half a year) dropped by 91,000 in February, but has dropped 1,095,000 over the past year, since February 2014.
- This report is a very good report in almost every respect; it will be interesting to see on what the negative "pundits" decide to focus.
February 2015 reports: (Notation on the links will be changed to "UPDATED for FEBRUARY" when the updated reports become available.)
- How Many Jobs Created or Lost Under Obama? - UPDATED for FEBRUARY
- How Many Jobs Lost or Gained in February 2015? - UPDATED for FEBRUARY
- Jobs Lost/Gained Year by Year Since 1999 - UPDATED for FEBRUARY
- How Many People Have Been Fired in 2014? Updated with 2014 numbers
Preview (written Thursday night):
"The pundits" expect about 235,000 more jobs when the BLS counts are released tomorrow morning at 8:30 a.m., with the unemployment rate remaining dropping .1% back to 5.6%. If there are many more jobs but the unemployment rate stays the same, this would be a good indication that more people have entered the labor force in February, as they did in January. If there is a wild card in this month's numbers, it is due (again) to really poor weather in the Midwest and Northeast.
- The ADP private payroller report came out yesterday which estimated an additional 212,000 private sector jobs in February. Estimates for December and January were raised. According to ADP's estimates, the US has added over 200,000 private sector jobs for at least the last 13 months.
- Reuters reports that "About 238,000 jobs are expected to have been added in February, according to the non-farm payroll report that will be released on Friday, down from the 257,000 added in January."
- The ISM (Institute of Supply Management) Employment Index increased 4.8 percentage points to 56.4 percent from the January reading of 51.6 percent and "indicates growth for the 12th consecutive month."
- Bloomberg believes that the BLS report "may show U.S. payrolls rose by 235,000 in February, a slower pace than a month earlier, according to economists surveyed by Bloomberg."
- The Consumer Sentiment index for February compiled by the University of Michigan decreased to 95.4 from the January reading of 98.1. But the Michigan people caution: "Consumer optimism was affected by lower gas prices and an unusually harsh winter. The small overall decline from January still left consumer confidence at the highest levels in eight years. It is hard not to attribute the small February decline to the temporary impact of the harsh weather, as declines that occurred in the Northeast and Midwest were triple the average loss, while Southern residents grew more optimistic. Low gas prices had a larger impact on lower income households, narrowing the difference between low and high income households. The data indicate that total real personal consumption expenditures will grow at 3.3% during 2015."
- "The Rasmussen Employment Index which measures worker confidence "rose a point in February to tie the highest level measured in six years. At 104.2, worker confidence is up from 103.3 in January and matches December’s all-time high."
- Job search engine Linkup.com was the outlier again, but this time positively, projecting a net gain of 370,000 jobs in February. (They base their projections largely on job openings.)
- The number of Americans filing new claims for unemployment benefits has risen for the last few weeks, and it rose last week "to its highest level since May, which could raise concerns about some weakness in the labor market." according to MSN Money. (However, this increase in the number of new claims could also be the result of terrible weather, both excessive snow and cold, this past month.)Money also noted: "Other data on Thursday showed nonfarm productivity contracted more sharply than previously thought in the fourth quarter as output failed to keep up with a jump in hours. Initial claims for state unemployment benefits increased by 7,000 to a seasonally adjusted 320,000 for the week ended Feb. 28, the highest reading since mid-May, the Labor Department said on Thursday."
January 2015 Highlights:
- +257,000 new payroll jobs; +267,000 new private sector jobs. These large increases are higher than the concensus of the "pundits".
- Whoa! The BLS increased its December and January numbers quite a bit: " The change in total nonfarm payroll employment for November was revised from +353,000 to +423,000, and the change for December was revised from +252,000 to +329,000. With these revisions, employment gains in November and December were 147,000 higher than previously reported. Monthly revisions result from additional reports received from businesses since the last published estimates and the monthly recalculation of seasonal factors. The annual benchmark process also contributed to these revisions." Those are really big revisions.
- Unemployment rate increased slightly by .1% (one tenth of a percent) to 5.7%. This increase was largely due to statistical revisions in the numbers of people in the population. The number of people employed, unemployed, in the labor force, and in the civilian population all increased as the BLS discovered that the civilian population increased by about 700,000 more than previously estimated.
- Alternate unemployment rate increased slightly to 11.3% (from 11.2%). Again, this increase was mostly due to annual population adjustments.
- Labor force participation rate increased .2%. The estimate of the number of people in the labor force increased by a whopping 1,051,000 due largely to population adjustments. (This means that the number of people in the labor force had been underestimated for most of 2014.) The reported number of people employed increased by 759,000, the reported number of people unemployed increased by 291,000.
- Number of people working full-time increased by about 777,000 while number of people working part-time increased by about 40,000. That's 3,061,000 MORE people working full-time over the past year, since January 2014, and 13,000 FEWER people working part-time over the past year.
- The number of involuntary part-time workers (people working part-time because they couldn't find full-time work) increased by 20,000 in January and dropped 464,000 over the past year, since January 2014.
- The number of long-term unemployed (people looking for work over half a year) increased by 15,000 in January, but has dropped 828,000 over the past year, since January 2014.
Since the "trough" of the recession in late 2009/early 2010 in seasonally adjusted numbers:
- 11.2 million MORE jobs in total
- 11.8 million MORE private sector jobs
- 10.2 million MORE people working
- 10.2 million MORE people working full-time.
- 67,000 MORE people working part-time.
- (Yes, despite what you may have heard, from the depth of the recession until now, we have many more additional people working full-time vs. part-time jobs. When a recession hits, companies generally cut back on full-time workers first. When companies start hiring again, the number of full-time workers increases.)
Since Bush left office & Obama took office (January 2009) in seasonally adjusted numbers:
- 6.9 million MORE jobs in total
- 7.6 million MORE private sector jobs
- 6.0 million MORE people working
- 4.9 million MORE people working full-time
- 1.2 million MORE people working part-time
January 2015 reports:
- How Many Government Jobs Lost or Added Under Obama? - not yet updated for January
- How Many People Have Been Fired in 2014?
Reports for prior year (2014) HERE!
General: