AUG#: +130,000 jobs.

Unemployment up at 3.7%...AUG jobs under Trump HERE

Wednesday, July 31, 2013

ADP 200,000 Private Sector Jobs Added July 2013


ADP report shows that private businesses added 200,000 jobs in July. Businesses of all sizes added to job growth.    


ADP job numbers for July 2013 show continued increasingly robust private-sector job growth as private employers add 
200,000 jobs.


The monthly jobs report from the payroll processor ADP is usually seen as a bellweather of the national jobs report from the Bureau of Labor Statistics that  is released a couple of days later.  This morning's ADP report seems to indicate that the private sector, despite tax increases and the sequester, continued to add jobs, this month, a significant number of  jobs, for the 41st consecutive month.  The turnaround started in February 2010.

ADP's numbers are based on their own payroll transactions, "
Bureau of Labor Statistics employment data, and the Philadelphia Federal Reserve Bank’s AruobaDiebold-Scotti Business Conditions Index. The sample size of the ADP data set (is derived from data) which accounts for more than 20 percent of all U.S. private sector employees."

BLS Jobs Numbers and Unemployment Rate To Be Released Friday, August 2nd.


Bureau of Labor Statistics employment reports are not released until Friday, so we will have to wait until then (August 2nd) to see if the BLS agrees.

Last month, ADP claimed 188,000 new private sector jobs (revised upwards to 198,000 new private sector jobs this month) while the BLS estimated that 202,000 private sector jobs were added.  ADP estimated that 992,000 private sector jobs were added in the first six months of 2013 (through June), while the BLS estimated that 1,234,000 private sector jobs were added in those same first six months.


ADP writes:

Private-sector employment increased by 200,000 from June to July, on a seasonally adjusted basis... June’s job gain was revised upward from 188,000 to 198,000.
Highlights: 
  • Small businesses (1-49 employees) +82,000
  • Medium businesses (50-499 employees) +60,000
  • Large businesses (500 or more employees) +57,000

The ADP report also shows that most job growth occurred in the service-providing sector which added 177,000 out of the 200,000 jobs last month. The goods producing segment was estimated to have increased by 22,000 jobs.  Construction increased by 22,000 and manufacturing decreased by 5,000.

ADP also puts out a small business report, detailing the job gains in businesses with under 50 employees.  You can find it HERE.
Mark Zandi, chief economist of Moody’s Analytics, is quoted in the ADP report: 
Job growth remains remarkably stable. Businesses are adding to payrolls in most industries and across all company sizes. The job market has admirably weathered the fiscal headwinds, tax increases and government spending cuts. This bodes well for the next year when those headwinds are set to fade.
When attempting to make any sense of this ADP report, here are a few things to consider:
  • This is an estimate based mostly on ADP's survey of its payroll processing private-sector clients.  Over time, it moves in parallel with the government's BLS Establishment numbers, but it is not perfectly in synch with the government's numbers.  Also, the government reports may be more accurate in tallying small startups which may not be using a payroll processing service.  The ADP numbers usually run about 300,000 to 600,000 lower than the BLS private jobs numbers in total jobs, not in increases or decreases of jobs.
  • To reiterate what I've mentioned in previous months, the stock market moves up or down not in concert with any reports of job growth (we haven't had any decline in total private jobs in three years.), but in concert with reports of job growth compared to what the pundits THINK the reports should say.  
  • Headlines are often sensational and sometimes absurd.

Monday, July 29, 2013

July 2013 Unemployment Rate Jobs Numbers

July 2013 Jobs Numbers and Unemployment Rate have been released.  This post will be updated as specific reports are published.
  • The private payroller, ADP, which always announces its jobs report a day or two ahead of the BLS jobs report, believes that 200,000 private sector jobs were added in July 2013.  Details HERE. 
Highlights:
  • 162,000 new nonfarm payroll jobs (net)
  • 161,000 new private sector nonfarm jobs
  • Prior months revisions:  Down 26,000.
  • Unemployment rate down .2% to 7.4%.
  • Number of people unemployed down 263,000.
  • Government gained 1,000 jobs
  • Civilian labor force declined by 37,000.
  • People employed (includes farm workers and the self-employed) increased by 227,000.  This indicates that the unemployment rate decreased due to people becoming employed, not because people left the labor force. 
  • Alternate (U-6) unemployment rate decreased .3% to 14.0%.
  • The percent of people working full-time essentially the same over the past month, from 80.52% down to 80.46%.  The percent of people working full-time over the past year essentially the same, from 80.48% to 80.46%.  The unemployment rate of people looking for full-time work dropped to 7.6% from 7.9%.
  • The number of long term unemployed (over 27 weeks) dropped by 72,000, but the average duration of unemployment crept up to 36.6 weeks.  Median duration ticked down to 15.7 weeks.  This indicates that, while the newly unemployed person is finding work more quickly, the long-term unemployed person continues to struggle. 

Watch this post.  As details and reports are published Friday, the following links will be added or updated and you will see notations for July replace those for June.


Other Recent Posts About Employment and the Labor Market:

Sunday, July 28, 2013

Changes in State Eligibility for Unemployment Insurance (August 2013)

Changes in state unemployment rates announced last week have resulted in changes in availability of unemployment insurance benefits in California, Rhode Island, and Washington.  Changes will take effect August 10th.

Changes in availability of unemployment insurance benefits in Alaska are also listed.  Those changes will take effect August 24th.  

**********************************
There have been changes to available weeks of benefits in North Carolina, Delaware, Illinois, Alabama, Mississippi, and Michigan in recent months.  Please check THIS LINK (How Many Weeks of Unemployment Will I Get?) for details.

**********************************


As unemployment insurance benefits are tied into the unemployment rate for your particular state, changes to your state's unemployment rate may increase or decrease the number of weeks of benefits to which you are entitled.

Weeks of unemployment insurance availability are changing for California, Rhode Island, Washington, and Alaska. 

The Department of Labor announced changes HERE for the above listed states on July 21st and August 3rd, as listed below:


  • People in California Cannot Move To Tier 4:
California's TUR has fallen below 9.0% and triggers "off" Tier 4 of EUC08 effective 8/10/2013. 

Based on data released by the Bureau of Labor Statistics on July 19, 2013, the three month average, seasonally adjusted total unemployment rate in California fell below the 9.0% trigger rate threshold to remain "on" in Tier 4 of EUC08. The week ending August 10, 2013, will be the last week in which EUC08 claimants in California who have exhausted Tier 3, and are otherwise eligible, can establish Tier 4 eligibility.  
The maximum number of weeks of unemployment insurance available in California will decline from 73 weeks to 63 weeks after August 10, 2013, though people on Tier 4 before August 10th can complete those 10 weeks.

  • People in Rhode Island Cannot Move to Tier 4:  

Rhode Island's TUR has fallen below 9.0% and triggers "off" Tier 4 of EUC08 effective 8/10/2013. 

Based on data released by the Bureau of Labor Statistics on July 19, 2013, the three month average, seasonally adjusted total unemployment rate in Rhode Island fell below the 9.0% trigger rate threshold to remain "on" in Tier 4 of EUC08. The week ending August 10, 2013, will be the last week in which EUC08 claimants in Rhode Island who have exhausted Tier 3, and are otherwise eligible, can establish Tier 4 eligibility. 
 The maximum number of weeks of unemployment insurance available in Rhode Island will decline from 73 weeks to 63 weeks after August 10, 2013, though people on Tier 4 before August 10th can complete those 10 weeks.

  • People in Washington Cannot Move to Tier 3: 

Washington's TUR has fallen below 7.0% and triggers "off" Tier 3 of EUC08 effective 8/10/2013. 

Based on data released by the Bureau of Labor Statistics on July 19, 2013, the three month average, seasonally adjusted total unemployment rate in Washington fell below the 7.0% trigger rate threshold to remain "on" in Tier 3 of EUC08. The week ending August 10, 2013, will be the last week in which EUC08 claimants in Washington who have exhausted Tier 2, and are otherwise eligible, can establish Tier 3 eligibility.
 The maximum number of weeks of unemployment insurance available in Washington will decline from 63 weeks to 54 weeks after August 10, 2013, though people on Tier 3 before August 10th can complete those 9 weeks.
  • People in Alaska Cannot Move to Tier 3: 
Alaska's IUR fell below 4.0% and triggers "off" Tier 3 of EUC08 effective 8/24/2013.

Based on data from Alaska for the week ending August 3, 2013, the 13 week insured unemployment rate in Alaska is below the 4.0% trigger rate threshold to remain "on" in Tier 3 of EUC08. The week ending August 24, 2013, is the last week in which EUC claimants in Alaska could exhaust Tier 2 and establish Tier 3 eligibility. Under the phase-out provisions, claimants could receive any remaining entitlement they had in Tier 3 after August 24, 2013.

The maximum number of weeks of unemployment insurance available in Alaska will decline from 63 weeks to 54 weeks after August 24, 2013, though people on Tier 3 before August 24th can complete those 9 weeks.  

Thursday, July 18, 2013

Weekly Initial Claims Decline

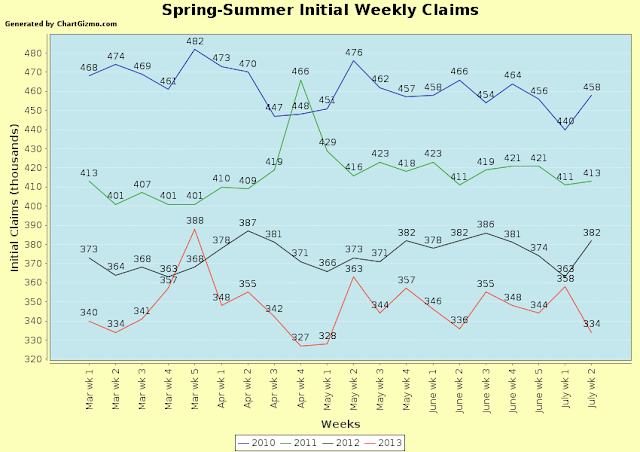
Weekly unemployment initial claims decreased by 24,000 this week to 334,000 after increasing substantially last week.  While weekly claims continue to fluctuate, they are unable to break below a mid 300,000 range of claims, as is obvious from the chart below.


Weekly claims numbers tend to be volatile and weekly seasonal adjustment factors can also throw the numbers off.  This is particularly true the first two weeks of a quarter when more people generally file for unemployment insurance.  As this past week was the second week of the quarter (after a large spike last week, the first week of the quarter) , we'll have to watch over the next few weeks to see if this "noise" around the start of the quarter is at all  significant. 


First time seasonally adjusted unemployment jobless claims declined to 334,000  for the week ending July 13th, a decrease of 24,000 claims.  Since the first week of March, new weekly claims have remained in the 325,000 to 365,000 range for nineteen out of the past twenty weeks.  

The four-week moving average # of claims, which smooths some of the week-to-week volatility, decreased by 
5,250 last week after increasing by 6,000 the week before.  It is now 346,000.  Initial claims continue now at about the same level that they were five years ago, in late 2007 to early 2008.  


(Even though the weekly initial claims numbers are seasonally adjusted, these numbers are always a bit volatile and should  only be analyzed in terms of a trend over a period of weeks.  See the graph below.) 


For the week ending June 29th, 4,519,501 people were receiving unemployment benefits under one of the programs that are available (regular state, federal extended unemployment compensation, or a few other smaller programs).  This was a decrease of about 2,000  overall claims since the previous week. The decrease was due to a 24,000 decline in the number of people receiving benefits under the Federal Extended Benefits program (the "Tiers") while claims made under the Regular State program (the first 19 to 26 weeks) increased about 27,000.


About 1,234,000 FEWER 
people are receiving unemployment benefits now vs. one year ago.  We do not know what has happened to the people who are no longer receiving benefits; we do not know how many of those 1,234,000 people found employment, how many retired, and how many are still looking for work.  We do know that:

  • There are 1,610,000 more people reporting themselves as employed than a year ago.
  • There are  2,293,000 more non-farm jobs.  
  • We also know that a grand total of 51,864,000 hires have been made by employers between May 2012 and May 2013, the latest month for which numbers are available.  (Some people may have been hired more than once during the year, so the number of "hires" is generally higher than the number of people who have been hired.)  
  • However, according to the Bureau of Labor Statistics JOLTS (Job Openings, Layoffs, and Turnover Survey) for May 2013, we still have about 3.1 active jobseekers for every job opening out there. 
  • The percent of unemployed people receiving benefits dropped significantly to about 36.9% for the week ending June 29th.


If you are receiving benefits, you may be interested in these reports:  


The chart above is one of the BEST charts for understanding and observing changes in the weekly initial claims numbers over time.  This year (red:  2013) and the past three years (blue:  2010green:  2011 and black:  2012) are marked in different colors.  You can see that, as a trend, first time claims for unemployment have declined from one year to the next, even though there are variations within the year.  Though the number of initial unemployment claims has been variable over the past three months, it has continued a downward trajectory.  

Be aware that:
  1. The graph above shows first time claims, so people who have continued to receive benefits or who have lost unemployment benefits are not counted in these numbers.  
  2. They are seasonally adjusted, so most variations caused by weather or holidays are already included in these numbers.  
  3. As these are weekly numbers, they are more volatile than the monthly numbers.


In the week ending July 13, the advance figure for seasonally adjusted initial claims was 334,000, a decrease of 24,000 from the previous week's revised figure of 358,000. The 4-week moving average was 346,000, a decrease of 5,250 from the previous week's revised average of 351,250.
As usual, to put all of this into perspective, check out the red line on the chart above to see where jobless claims are now, in 2013, compared to the past three years.

First time unemployment claims decreased by 26,000 over those reported last week.  Last week's initial claims numbers were revised downwards by 2,000.  There are usually slight upwards revisions  (1,000 to 3,000) in the numbers of initial claims in most weeks, so a downwards revision is unusual.  (The chart above shows REVISED claims numbers.)

The initial claims as announced last week were 360,000, so the claims from that week were revised downwards by 2,000 to 3580,000. 


Current Spring Initial Claims Continue to be the Lowest Since Late 2007/Early 2008.

As a whole, the current numbers of initial claims continue to be the lowest Winter-Spring initial claims numbers since late 2007/early 2008.
  

Continuing regular state claims, from people who are continuing to claim unemployment through the initial 20 to 26 week regular unemployment program, increased by 91,000 for the week ending June 29th after increasing by 70,000  the week before.  3,114,000 people filed continuing regular state claims in the week ending July 6th.  As a whole, continuing regular claims continue to decline slowly despite some individual weekly increases.  (There were 3,317,000 continuing claims a year ago.) 

Total number of people receiving unemployment insurance is a very low 36.9% of the officially unemployed for the week ending June 29th.  

The weekly report also tells us the total number of people who are receiving unemployment benefits.  For the week ending June 29th, 4,519,501 people were receiving unemployment benefits under one of the programs that are available (regular state, extended benefits, federal extended unemployment compensation, or a few other smaller programs).  This compares with 12,248,000 people who are unemployed in unadjusted numbers according to the monthly June unemployment situation report which was released Friday, July 5th.  Those numbers, showing that only 36.9% of the officially unemployed are receiving benefits, should make it clear that people do NOT need to be receiving unemployment insurance to be counted among the unemployed.  (This ratio and these two numbers are NOT seasonally adjusted.)

Extended Benefits (EB) No Longer Available in any State


As of the week ending June 29th, only 433 people were still receiving Extended Benefits, as mentioned above.  A year ago, 41,113 people were receiving Extended Benefits.  As recently as April 2012, 412,411 people were receiving Extended Benefits.

Therefore, over the 15 months, 99.9% of the people who were receiving Extended Benefits are no longer receiving such benefits.  We do not know how many of these 412,000 people receiving Extended Benefits in April 2012 have found jobs, how many have another source of income in the family, and how many have nothing. 

To reiterate, while a decrease in the number of people FILING for initial claims is a good thing and indicates that fewer people are being laid off, a decrease in the TOTAL number of people getting unemployment insurance may only show that fewer people are eligible for unemployment insurance benefits.

Any questions or confusion, please leave a comment or email me!


Saturday, July 13, 2013

After the Zimmerman/ Trayvon Martin Verdict:

George Zimmerman Walks...

The following was inspired by the disturbing verdict in the George Zimmerman trial:


Written by Margie and found on Facebook: 
"I want everyone to take the anger, their raw emotion, and take action. Not violence, no that would be wrong. We need to take this country back. We need to take back every county and small town. We need to take back every school, every city, every county, every judgeship. We need to take back every state, every state senator, every governorship. We need to take back every congressman's seat and senator's seat. We need to take back our courts from traffic court to Supreme Court. We need to take it all back, NOW!"
(Cross posted at Both Parties Are NOT the Same)

Friday, July 12, 2013

How Many Jobs Have Been Lost or Gained in the Past Year? (June 2012 through June 2013)

Note:  The following report, which provides year over year or current compared to prior year jobs data, is a new monthly feature at Molly's Middle America.
June 2013 BLS Jobs Numbers and Unemployment Rate Were Released Friday, July 5th.  Check HERE for details.

2,293,000
 new jobs were CREATED or ADDED during the past year, from June 2012 to June 2013.  


The private sector generated (added) 2,357,000 new jobs, but the government sector continued to shed (lose) jobs, 64,000 jobs, in year over year from June 2012 to June 2013.

1,266,000 MORE people reported themselves as working or employed, including people who are self-employed or working in agriculture, in the past year from June to June. 
         

The unemployment rate has declined from 8.2% in June 2012 to the current 7.6% in June 2013.  The decline has been due to an increase in the number of people employed (from 142,448,000 to 144,058,000) and a decrease in the number of people unemployed (from 12,701,000 to 11,777,000) while the Civilian Labor Force increased from 155,149,000 to 155,835,000 between June 2012 and June 2013.  The unemployment rate has been below 8.0% for 10 months in a row now.  

Initial Unemployment Claims Rise.. What Does It Mean?

Weekly unemployment initial claims increased by 16,000 this week to 360,000 after decreasing the last two weeks.  Weekly claims continue to be unable to break below a mid 300,000 range of claims, as is obvious from the chart below.  


Weekly claims numbers tend to be volatile and weekly seasonal adjustment factors can also throw the numbers off.  This is particularly true  the first two weeks of a quarter when more people generally file for unemployment insurance.  As this past week was the first week of the quarter, we'll have to watch over the next few weeks to see if this week's increase is at all significant.  

First time seasonally adjusted unemployment jobless claims increased to 360,000  for the week ending July 6th.   This is an increase of 14,000 claims.  Since the first week of February, new weekly claims have remained in the 325,000 to 365,000 range for nineteen out of the past twenty-two weeks.  

The four-week moving average # of claims, which smooths some of the week-to-week volatility, increased by 
6,000 last week after decreasing by 500 the week before.  It is now 351,750.  Initial claims continue now at about the same level that they were five years ago, in late 2007 to early 2008.  


(Even though the weekly initial claims numbers are seasonally adjusted, these numbers are always a bit volatile and should  only be analyzed in terms of a trend over a period of weeks.  See the graph below.) 


For the week ending June 22nd, 4,505,508 people were receiving unemployment benefits under one of the programs that are available (regular state, federal extended unemployment compensation, or a few other smaller programs).  This was a decrease of about 52,000  overall claims since the previous week.  The decrease was divided between continuing claims in the Regular State program (the first 19 to 26 weeks of unemployment benefits), which decreased by 21,000,  and continuing claims in the Federal Extended Unemployment Benefits program (the "Tiers"), which decreased  by about  23,000 claims.

About 1,370,000 FEWER 
people are receiving unemployment benefits now vs. one year ago.  We do not know what has happened to the people who are no longer receiving benefits; we do not know how many of those 1,370,000 people found employment, how many retired, and how many are still looking for work.  We do know that:

  • There are 1,610,000 more people reporting themselves as employed than a year ago.
  • There are  2,293,000 more non-farm jobs.  
  • We also know that a grand total of 51,864,000 hires have been made by employers between May 2012 and May 2013, the latest month for which numbers are available.  (Some people may have been hired more than once during the year, so the number of "hires" is generally higher than the number of people who have been hired.)  
  • However, according to the Bureau of Labor Statistics JOLTS (Job Openings, Layoffs, and Turnover Survey) for May 2013, we still have about 3 active jobseekers for every job opening out there. 
  • The percent of unemployed people receiving benefits dropped significantly to about 36.8% for the week ending June 22nd.


If you are receiving benefits, you may be interested in these reports:  


The chart above is one of the BEST charts for understanding and observing changes in the weekly initial claims numbers over time.  This year (red:  2013) and the past three years (blue:  2010green:  2011 and black:  2012) are marked in different colors.  You can see that, as a trend, first time claims for unemployment have declined from one year to the next, even though there are variations within the year.  Though the number of initial unemployment claims has been variable over the past three months, it has continued a downward trajectory.  

Be aware that:
  1. The graph above shows first time claims, so people who have continued to receive benefits or who have lost unemployment benefits are not counted in these numbers.  
  2. They are seasonally adjusted, so most variations caused by weather or holidays are already included in these numbers.  
  3. As these are weekly numbers, they are more volatile than the monthly numbers.


In the week ending July 6, the advance figure for seasonally adjusted initial claims was 360,000, an increase of 16,000 from the previous week's revised figure of 344,000. The 4-week moving average was 351,750, an increase of 6,000 from the previous week's revised average of 345,750.
As usual, to put all of this into perspective, check out the red line on the chart above to see where jobless claims are now, in 2013, compared to the past three years.

First time unemployment claims increased by 17,000 over those reported last week.  Last week's initial claims numbers were revised upwards by 1,000.  There are usually slight upwards revisions  (1,000 to 3,000) in the numbers of initial claims in most weeks.  (The chart above shows REVISED claims numbers.)

The initial claims as announced last week were 359,000, so the claims from that week were revised upwards by 1,000 to 360,000. 


Current Spring Initial Claims Continue to be the Lowest Since Late 2007/Early 2008.

As a whole, the current numbers of initial claims continue to be the lowest Winter-Spring initial claims numbers since late 2007/early 2008.
  

Continuing regular state claims, from people who are continuing to claim unemployment through the initial 20 to 26 week regular unemployment program, increased by 24,000 for the week ending June 29th after decreasing by 34,000  the week before.  2,977,000 people filed continuing regular state claims in the week ending June 29th.  As a whole, continuing regular claims continue to decline despite some individual weekly increases.  (There were 3,311,000 continuing claims a year ago.) 

Total number of people receiving unemployment insurance is a very low 36.8% of the officially unemployed for the week ending June 22nd.  

The weekly report also tells us the total number of people who are receiving unemployment benefits.  For the week ending June 22nd, 4,505,508 people were receiving unemployment benefits under one of the programs that are available (regular state, extended benefits, federal extended unemployment compensation, or a few other smaller programs).  This compares with 12,248,000 people who are unemployed in unadjusted numbers according to the monthly June unemployment situation report which was released Friday, July 5th.  Those numbers, showing that only 36.8% of the officially unemployed are receiving benefits, should make it clear that people do NOT need to be receiving unemployment insurance to be counted among the unemployed.  (This ratio and these two numbers are NOT seasonally adjusted.)

Extended Benefits (EB) No Longer Available in any State


As of the week ending June 22nd, only 465 people were still receiving Extended Benefits, as mentioned above.  A year ago, 43,937 people were receiving Extended Benefits.  As recently as April 2012, 412,411 people were receiving Extended Benefits.

Therefore, over the last year, 99.9% of the people who were receiving Extended Benefits are no longer receiving such benefits.  We do not know how many of these 412,000 people receiving Extended Benefits in April 2012 have found jobs, how many have another source of income in the family, and how many have nothing. 

To reiterate, while a decrease in the number of people FILING for initial claims is a good thing and indicates that fewer people are being laid off, a decrease in the TOTAL number of people getting unemployment insurance may only show that fewer people are eligible for unemployment insurance benefits.

Any questions or confusion, please leave a comment or email me!