AUG#: +130,000 jobs.

Unemployment up at 3.7%...AUG jobs under Trump HERE

Sunday, December 16, 2012

Gun Control Won't Fix Everything - But It Can't Hurt

Twenty children, little children, first grade children, the same age of the children that I taught many years ago.  Killed.  Gone.  


Six adults whose life work was educating and caring for children, little children; work that I did a decade ago.  Killed.  Gone.


One young man, social problems most of his life, the same age as a young man in our extended family who committed a crime and took his own life several years ago.  Dead through suicide.  Gone.


One mother who undoubtedly loved her son, agonized over his problems, probably tried to figure out how she could help him, the same way that the parents of the young man in my family agonized for years and tried to help.  The mother of the young man in Connecticut was killed and is gone.  The parents of the young man in our family still live, still deal with depression, often anxiety;  even though several years have passed, they are still trying to understand what happened to their beloved son.


Newtown, Connecticut. 

Sandy Hook Elementary School.  Adam Lanza.   Two days ago these names were meaningless.  Now they are not.  We all know where these places are.  We all know who Adam Lanza is.  

We know the names of many of the victims, both the victims who lived and the victims who died.  We know of the first grade teacher, Kaitlin Roig, who herded her children into a bathroom and managed to keep them quiet.   They all lived.  We know of another first grade teacher, Vicki Soto, who herded her children into cupboards and cabinets, somehow keeping them safe but not herself.  We know of the principal, Dawn Hochsprung,  and the school psychologist, Mary Sherlach, who instinctively tried to run to the gunman to physically make him stop.... but he got them first.  We know of the teacher,  Ann Marie Murphy, who threw her body on her little ones.. but her body didn't stop the bullets.  She died as did her young charges.


We saw television news personalities tearing up, some actually cutting their schticks short due to imminent emotional breakdown.  We saw the President of the United States in tears as he talked about these little children, six and seven years old, who died.


The cacophony of minutiae


And now the cacophony of minutiae, opinions, accusations, counter-opinions,  and counter-accusations.  The noise has been too loud for me, and I have barely posted or written in the past 48 hours as I deal with the conflicting feelings and memories; too many of the details are too close to things I have lived through as a teacher and as a human being in my extended family.    


  • Lack of gun control is the problem, many cry out.
  • Carry and conceal in schools is the answer!, others claim.
  • Armed guards in every school!, say some.
  • This is what happens when you take God out of schools, shout a few.
  • The President is weak, say others.. He needs to seek some kind of gun ban!
  • More mental health help!, others yell.
  • What's with that mother?  Why did she have guns around if the kid was mentally ill?
  • The media got everything wrong!  And interviewing kids?  That was horrible!
  • Mental illness, personality disorder, autism spectrum, Aspberger's.  People throw these terms around as if they know what they mean.

Look, people, I know a young man who stole his father's guns and held up a convenience store and then shot himself when he was about to be apprehended.   I know the family;  I knew the young man since he was very tiny.   


Gun control would not have saved him.


More mental health resources would not have saved him.   

We do not have the details of what happened to Adam Lanza.  Was he violent?  Did he threaten his mother.. or anybody, for that matter?  Had he ever so much as hurt a fly before December 14th?  Was he getting mental health help?  Was he diagnosed with anything? 


We don't know the answer to any of these questions... yet.  And even when we do get the answers to these questions, they may not help us to understand what was in Adam Lanza's head Friday morning, and they may not help us to understand how to prevent another Newtown, Connecticut, massacre.        


The Mother's Obsession With Guns

The mother's obsession with guns was profiled here at the New York Times.

Here's a comment:  


I hate guns and I do not understand why people would buy them. 
Until now, I have always blamed the NRA and have been somewhat optimistic that we only need people to get a bit more organized in order to improve legislation. 
Today, the statistic cited in one of the other articles was a real eye opener. Apparently 60% of Americans are happy with the current gun laws and do not want any additional restrictions. 
I do not see how the tragic situation in Newton could have been prevented. Mrs. Lanza bought the guns legally and had even trained on how to use them. 
I haven't read anything about her son having demonstrated any violence earlier, so I have to assume that is the reason she did not take any additional precautions. 
Obviously, in this country we have serious violence issues, which get compounded by loose legislation on guns. We also have serious mental health issues, but apparently the killer's condition had not raised concern. 
Most people in the NYT forums are vociferous about the need for gun control. I am with you, but I am also realistic and very pessimistic about any possible changes.

I do not see any need for those multiple clips that allow people to shoot a hundred rounds in a few seconds or a minute.  I don't know why that kind of firepower should be protected.

As I mentioned above, I knew a young man, close to the age of the Lanza young man, who had a lot of issues but no history of physically aggressive or violent behavior, who broke into his father's locked gun cabinet at the family's vacation home.  He and a friend took those hunting rifles and held up a convenience store.  As the police closed in, he shot himself.  Nobody was hurt except the young man.


I'm sure people would say the same thing about him... Why did his father have hunting rifles?  But there was no reason for the father NOT to have hunting rifles in a locked closet.  The son was not aggressive or violent.  He hadn't threatened anybody; he was just snotty and rebellious.  He'd been in various kinds of therapies, various special schools, various treatments for various addictions for years.  


Would this young man still be alive with stronger gun control laws?  I can't imagine that.  These were registered hunting rifles in a locked closet in a vacation home.  I will say that the family felt a sense of relief that the young man didn't take anyone with him as he checked out, unlike Adam Lanza.


I do think we need stronger gun control laws, and I welcome efforts to introduce legislation to outlaw assault weapons.  And we certainly need to eliminate the gun show loophhole.  But not all of these tragedies are going to be prevented unless all guns are outlawed.. and that will never happen.


Other articles and comments: 


I am Adam Lanza's Mother:  A great article about what it is like to deal with a seriously mentally ill adolescent, but I don't think we can say that the problems of this mother and her son are equivalent to the problems of Adam Lanza.  But a must-read article nonetheless.  My comment:


I completely understand the author's pain and I empathize with her son.. and with her love for her son. 

But we don't really know that Adam Lanza was like her Michael. We haven't heard of any hospitalizations, any other episodes of violence, any diagnoses that might shed some light on his actions. 

Adam was in public or private schools for about 10 years. He was pulled out when he was a sophomore or junior in high school, but, while people who knew him talked about how "strange" he was; nobody has mentioned out of control or aggressive behaviors. 

I don't think we can read this very heartfelt, very moving article and assume that Adam Lanza had the same issues. 

Now.. I do know children who had similar problems to those described by Michael's mother. I agree that mental health understanding and treatment of these children is not very solid. I taught elementary school for many years and I can remember two children who exhibited these kinds of completely out of control behaviors. Both were placed into specialized settings for children with behavioral disorders. Both had siblings who were completely "normal".  

These children are being lost, and that is so, so sad. 

And, no, the solution is NOT a slap or a spank as some (comments) here have suggested.”


Thursday, December 13, 2012

Private & Government Jobs Gained & Lost Under Obama (November Update)


How many jobs (total, private, and government) have been lost or gained since Obama was inaugurated?  
  • 4,317,000 TOTAL jobs (in seasonally adjusted numbers) were LOST in from the time Obama took office until the "trough" of the recession in early 2010.  That's a decrease of 3.2%.    
  • 4,608,000 jobs (in seasonally adjusted numbers) were CREATED from the "trough" of the recession until now, November 2012.  That's an increase of 3.6%.
  • In total, 291,000  jobs (in seasonally adjusted numbers) were ADDED from the time Obama took office until now, November 2012.  That's an increase of 0.2%.
  • We have experienced 26 months WITHOUT job losses since September 2010.  We have ADDED 3,967,000 jobs during those 26 months. 
  • We now have 133,852,000 TOTAL non-farm jobs. 
With Benchmark Revisions:
  • 4,317,000 TOTAL jobs (in seasonally adjusted numbers) were LOST in from the time Obama took office until the "trough" of the recession in early 2010.  That's a decrease of 3.2%.    
  • 4,994,000 jobs (in seasonally adjusted numbers) were CREATED from the "trough" of the recession until now, November 2012. 
  • In total, 677,000  jobs (in seasonally adjusted numbers) were ADDED from the time Obama took office until now, November 2012.   
  • We now have 134,238,000 TOTAL non-farm jobs. 
* Click on the link for information about Benchmark Revisions which were released last week by the Bureau of Labor Statistics.  The BLS databases will not be updated with these new numbers until January 2013.
*  These are all net figures, meaning that they represent the total number of jobs at the end of a reporting period.  All losses have been subtracted from all gains and vice verse.
    *  For the purposes of comparison, jobs are being added at a faster clip under Obama than under George Bush at the same time in his presidency.  At this point in Bush's presidency (November 2004), there were still 284,000 FEWER jobs than when he was inaugurated in January 2001 (compared to 291,000 MORE for Obama).  The number of jobs didn't eclipse the number when Bush was first inaugurated until February 2005, in Bush's second term.    


    How many PRIVATE sector jobs have been lost or gained since Obama was inaugurated?
    • 4,213,000 PRIVATE-sector jobs (in seasonally adjusted numbers) were LOST from the time Obama took office until the "trough" of the recession in early 2010.  That's a decrease of 3.8%.
    • 5,117,000 PRIVATE-sector jobs (in seasonally adjusted numbers) were GAINED OR CREATED from the "trough" of the recession until now, November 2012.  That's an increase of 4.8%.
    • In total, 905,000 private sector jobs (in seasonally adjusted numbers) have been GAINED from the time Obama took office until now, November 2012.  That's a net increase of 0.8%. *
    • We have experienced 33 months of positive private-sector job GROWTH from February 2010 until November 2012.  We have added 5,117,000 private-sector jobs during those 33 months.    
    • We now have 111,890  PRIVATE sector non-farm jobs.
    • 4,213,000 PRIVATE-sector jobs (in seasonally adjusted numbers) were LOST from the time Obama took office until the "trough" of the recession in early 2010.  
    • 5,570,000 PRIVATE-sector jobs (in seasonally adjusted numbers) were GAINED OR CREATED from the "trough" of the recession until now, November 2012. 
    • In total, 1,358,000 private sector jobs (in seasonally adjusted numbers) have been GAINED from the time Obama took office until now, November 2012. 
    • We now have 112,343,000 PRIVATE sector non-farm jobs.
    *Though, as of November 2012, we still have fewer private-sector jobs (in adjusted numbers) than when President Obama took office, jobs are being added at a faster clip under Obama than under George Bush at the same time in his presidency.  At this point in Bush's presidency (November 2004), there were still 1,141,000 FEWER private sector jobs than when he was inaugurated in January 2001 (compared to 1,358,000 MORE for Obama).  The number of private-sector jobs didn't eclipse the number when Bush was first inaugurated until June 2005, in Bush's second term.  
    How many GOVERNMENT jobs have been lost or gained since Obama was inaugurated?  (Government jobs include federal, state, and local government jobs.)
    • 102,000 GOVERNMENT jobs (in seasonally adjusted numbers) were LOST from the time Obama took office until the "trough" of the recession in early 2010.  That's a decrease of  .47%  (about half of a percent). 
    • Another 509,000 GOVERNMENT jobs (in seasonally adjusted numbers) were LOST from the "trough" of the recession until now, November 2012.  That's a decrease of 2.3%.    
    • In total, 614,000 GOVERNMENT jobs (in seasonally adjusted numbers) were LOST from the time Obama took office until now, November 2012.  That's a decrease of 2.7%.  A large portion of these jobs, at least 200,000, have been lost in the "Local Government - Education" sector. (Teachers.)
    • We have experienced decreases in the number of government jobs in 24 out of the last 30 months, starting in June 2010, when the layoff of 2010 Census workers began.  However, we have experienced slight increases in the number of government jobs in the last 3 out of the last 5 months.     
    • We now have 21,962,000 GOVERNMENT jobs, not including people in the military.  (Civilians employed by the U.S. and working for the military are counted.)
    • Another 576,000 GOVERNMENT jobs (in seasonally adjusted numbers) were LOST from the "trough" of the recession until now, October 2012.      
    • In total, 681,000 GOVERNMENT jobs (in seasonally adjusted numbers) were LOST from the time Obama took office until now, November 2012.
    • We now have 21,895,000 GOVERNMENT jobs, not including people in the military.  (Civilians employed by the U.S. and working for the military are counted.)
    (Note:  Current numbers taken from the June Bureau of Labor Statistics Employment Situation Report.  Historical numbers taken from various archived Employment Situation reports as indexed HERE. Specifics will be provided upon request; please email me or leave a comment.)

    An afterthought---

    A reader asks:

    How Many Private Sector Jobs Were Lost Because of Obama?

    We haven't lost ANY private sector jobs (net) since February 2010, a year after Obama took office.  Between January 2009 and February 2010, we lost 4,213,000 private sector jobs as stated above.

    Should we "blame" Obama for not being immediately able to stem the tide of private sector job loss in 2009?  If a house is burning out of control and the fire department comes to put out the fire, it continues to burn until it is brought under control and cooled down, right?  Now.. would you blame the fire department for the continued fire and the time to put it out after the firefighters arrive on the scene?

    Well, you might, but I wouldn't:  Here's my reasoning:  Burning Down the House!

    So my answer to this question would be a big, fat ZERO.  I do NOT feel that Obama is to blame for any loss of jobs between January 2009 and February 2010.  If you think he is, please leave a comment and explain your reasoning!

    Tuesday, December 11, 2012

    From a Rightie: You're Full of It!

    A great lesson on how the right wing lies, obfuscates, and misrepresents:


    Google "73% of new jobs are government jobs" and every right-wing blog and website from here to the moon will jump out at you begging you to click on their link.

    Except that it is a lie.

    I've seen this lie posted on many forums, discussion boards, and rightie blogs over the weekend.  I read through the BLS (Bureau of Labor Statistics) reports and databases pretty carefully as soon as they are released, and I knew this was just plain bullcocky.  It took me a while to find the source, as one rightie was copying this almost verbatim from another rightie.

    Foul Excrement

    The righties.. not sure which particular brand of righties..are playing tricks on their followers; and their followers, many of whom would not know a fact if it dropped from the sky and hit them on the head, are buying this foul excrement and spreading it all over the Internet.

    Here's the schtick, apparently based on something posted at the right wing rag CNS (Sorry, as of this minute I do not have a direct link; I'll try to find one.): 
    (CNSNews.com) – Seventy-three percent of the new civilian jobs created in the United States over the last five months are in government, according to official data published by the Bureau of Labor Statistics. 
    In June, a total of 142,415,000 people were employed in the U.S, according to the BLS, including 19,938,000 who were employed by federal, state and local governments. 
    By November, according to data BLS released today, the total number of people employed had climbed to 143,262,000, an overall increase of 847,000 in the six months since June. 
    In the same five-month period since June, the number of people employed by government increased by 621,000 to 20,559,000. These 621,000 new government jobs created in the last five months equals 73.3 percent of the 847,000 new jobs created overall.

    This is how the right wingers take numbers out of context without understanding and how they use them to deceive their gullible flock.  It's probably the BEST example I've seen of lying with numbers lately.  Look at the definition of propaganda techniques HERE and read about "Card Stacking".  This is classic.  

    Here's my explanation of this absurd b.s.:

    Whoever came up with this and spread it throughout the right wing blogosphere is using numbers from the Bureau of Labor Statistics reports without knowing their meaning and context.  Or someone wanted to DELIBERATELY fool the right-wingers--- again.

    First of all, the specific numbers that are included in that CNS piece are correct... You can find those numbers on various Bureau of Labor Statistics charts.  But those numbers have been taken out of context and are completely meaningless. 

    There are TWO different surveys from TWO different sources that are part of the monthly jobs numbers:
    • The Establishment Survey (the "jobs" or "payroll" report) uses numbers from incorporated businesses who have people on their payrolls.
    • The Household Survey (the unemployment rate and number of people working) relies on self-reported numbers. The Household Survey also gets  information from agricultural workers and people who are self-employed. (These groups of workers are not part of the Establishment Survey "jobs" numbers, but they are part of the unemployment rate and the number of people employed and unemployed).  

    The Establishment Survey uses a bigger sample, meaning a higher percentage of its base, and it is therefore more accurate and less volatile than the data that comes from the Household Survey (which is one reason why numbers of people employed, the unemployment rate, and the number of people in the Civilian Labor Force tend to jump up and down quite a bit.)


    The propaganda from CNS uses numbers that come from the Household Survey.  They are NOT using the numbers of employees reported on the more accurate and consistent Establishment Survey.  


    The CNS piece is comparing numbers taken from June and comparing them to numbers taken in November.  Now numbers from both the Household and the Establishment Survey are seasonally adjusted, meaning adjusted for  variations that happen regularly at various times of the year.

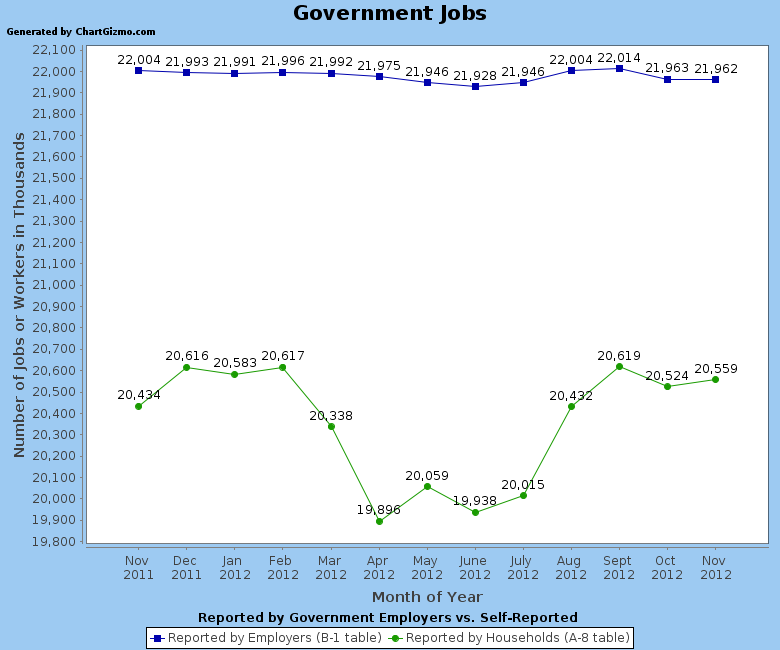
    However, the reality is that the number of people who say they are working for the government on the Household Survey goes down during the summer (think teachers), even with the seasonal adjustments, which sometimes can be a bit off.  You can see the summer drop  in the graph below.

    In "real" unadjusted jobs numbers, the number of employees in the state "Government: State and Local Education" sectors go down about 2,000,000 each summer.  

    They reach their nadir in July and start coming back in August.  So... unless those seasonal adjustments are really perfect, comparing government numbers in summer with those in the fall is going to be really, really, REALLY deceptive.  And the Household numbers seasonal adjustments are often not that perfect and they are much LESS perfect than the Establishment seasonal adjustments.  
        
    So let's look at numbers that make more sense:  The numbers from November 2011 to November 2012: 

    • From the Establishment "jobs" report:  1,889,000 MORE non-agricultural payroll jobs altogether, and 42,000 FEWER government jobs. That's from the BLS B-1 Establishment table.  
    • The Household Survey tables, when compared over a year, from Nov to Nov, show these results: 2,721,000 MORE people reporting themselves as employed (This includes agricultural workers and self-employed workers, but it also includes revisions for the 2010 Census). In that survey, 125,000 MORE people say they are working for the "government". I would guess that employers reporting payrolls are more accurate. 


    Here's a graph that shows the difference in government employment numbers as reported by employers (blue bar) and as reported by employees (green bar):


    Notice that the various government entities consistently report much higher employment than the people who say they work for the government.  There are a few possible reasons for this:  

    People who work a temporary or part-time government job, perhaps substitute teaching or working as a teacher's aide, may not report themselves as employed during the summer months, though they may still be listed on their employer's payrolls.  And the seasonal adjustments may just not be that good in the Household Survey.

    Here's a good rule of thumb:  Don't use the "A" Household tables to look at government numbers unless you are trying to deceive people.  They aren't reliable nor are they adequately adjusted for seasonal variations.

    Another good rule of thumb:  Look at numbers over a similar period of time.  A year is a good period of time.  Three months or six months might do, but you can't just take ONE three month or six month period..  you'd need to look at a few.  Any month when compared to any other random month will give you random results.  Even the monthly October-to-November numbers don't show much.  It takes a few months for any trend to really be significant.  

    My Closing Comment :

    My comment to one of the many who quoted this article with absolute faith that the right wing blogosphere would never think of leading them up Jon Stewart's Bullshit Mountain (Well, Fox's Bullshit Mountain.  Stewart just keeps reminding us of the smell.): 

    You are being lied to by CNS and other right wing outlets. 
    Look at the B-1 tables on the BLS databases and you will see that government jobs continue to decline. 
    CNS is using self-reported numbers from the Household survey, comparing June (when school is out) to November.  You are being used, lied to, and deceived.

    You're Full of It.

    His answer to that: 

    You're full of it.  

    Not much to say.  Yep, I certainly am full of facts, sources, and arithmetic.  But some people just have no interest in the truth.  They like their little bubbles of misinformation.

    Monday, December 10, 2012

    No! 350,000 DID NOT Leave The Labor Force In Misery and Despair in November!

    Ah, those Republicans!  Just one laugh after another!   
    Here Is Republican Dave Camp's take on the November jobs report:
    The unemployment rate fell in November because 350,000 people gave up looking for work and dropped out of the labor force, not because significant numbers of Americans found jobs.  In fact, the survey that is used to calculate the unemployment rate showed that employment actually fell by 122,000 last month. 

    Then Jack Welch has surfaced again, tweeting this time.  This is the guy who claimed Obama was cooking the books back before the election.
    Sept/October employment revised DOWNWARD 49K..November workers looking for work DROPS 350,000...INTERESTING!!!!
    Good heavens, people!  Especially Republicans.... Don't start spouting off unless you know what you are talking about!  You may well sound like a fool to anybody who knows better, like me.. and whoever reads this.

    No.  First, the civilian labor force is a volatile number.  Yes, 350,000 people left the labor force in November.  But 578,000 people JOINED the civilian labor force in October.  Altogether, over the past year, 1,354,000 people JOINED the labor force.  Did anybody tell you that?  

    People FLOW...

    There is a "flows" report which tells how many people stopped looking for work (went from unemployed to "not in the labor force") compared to how many people started looking for work (went from "not in the labor force" to unemployed).  Then the two "gross" numbers can be "netted" out.  Last month, there were only 16,000 more people who went from unemployed to not in the labor force (stopped looking for work) than people who went from not in the labor force to unemployed.

    Actually, the reason the labor force went down in November is not because people stopped "looking for work" but because people left their jobs.  Now why do I say "left their jobs" vs. being laid off?  Because if people were laid off, the flows report would show people going from employed to unemployed.  But, by and large, people went from employed to "not in the labor force".  That means that most of them quit their jobs.

    3,594,000 people who were not in the labor force in October were employed in November.  And 3,962,000 people who were employed in October reported themselves as not in the labor force.. meaning not looking for work.. in November.  That's a net of 368,000 people who decided to stay home.. and that's just about the same number as the net exodus of people in the labor force.

    Hundreds of Thousands Quit Their Jobs

    So, no, hundreds of thousands DID NOT stop looking for work; hundreds of thousands quit their jobs (though we don't know why).  And 231,000 of those people happen to be women; 136,000 are men.  But we still have NO idea as to why these people stopped working.  Retirement?  Perhaps.  Staying home with children or aging parents?  Perhaps.  But we don't know for sure.

    There's more to address in the Dave Camp statement:

    Throughout the Obama Administration, Americans have been dropping out of the labor force in droves.  This has led to significant “invisible” unemployment, as jobless individuals are no longer counted as officially unemployed once they have dropped out of the labor force and are no longer searching for work.  If these “invisible unemployed” individuals were in the official labor force, they would be counted as officially unemployed – raising the current 7.7 percent unemployment rate to almost 11 percent. 
    Sigh.
     

    Watch for my commentary on this. 

    Friday, December 7, 2012

    What Was the Unemployment Rate When Obama Took Office Compared To Now? (November 2012 Update)


    March 2013 reports will be released Friday, April 5th.  Check back then!


    What was the unemployment rate when Bush left office and Obama was inaugurated? 7.8%

    What was the unemployment rate after Obama's first full month in office (February 2009)?  8.3%


    What was the unemployment rate at peak?  10.0%

    What is today's (November 2012's) unemployment rate?   7.7%

    How many people were looking for work when Obama was inaugurated; how many were working?  And how many people are looking for work and how many are employed now?
    • Read below the graph.

    • The following chart shows the unemployment rate in three month intervals plus the current month:  


    Why are there two lines, one for "Seas Adjusted" and one for "Unadjusted"?

    The Bureau of Labor Statistics uses seasonal adjustments to adjust for the volatility in the labor market from one month to the next.  The relatively even red line above shows the unemployment rate based on seasonally adjusted numbers.  The jagged green line shows the unemployment rate based on "real", "raw" numbers; the unadjusted rate.  Notice that the green line goes up in January (after holiday layoffs) and July (school-related layoffs), and it goes down in October and April, which are strong months for workers.  (Employees are all back to school in October, and employers are staffing up for the holidays.  Schools are also full in April and employers are starting to staff up for summer, construction, vacation venues, etc.)  The green line, however, reflects "reality":  Your friends, neighbors, and family members actually working or not working.  

    November 2012 Jobs News Highlights


    November Jobs Reports & Summaries: 
    • November Summary: Report shows INCREASES in total jobs and private-sector jobs; government jobs are even.  Unemployment is down two-tenths of a point to 7.7% as 200,000 fewer people report themselves as unemployed.  
    • However, there were 350,000 fewer people in the civilian labor force, and 122,000 fewer people (in seasonally adjusted numbers) report themselves as employed in November vs. October.  However, the decrease in employment was among part-time employees; not among full-time employees. 
    • Unemployment in all race, age, and gender groups decreased during November.  The largest drop occurred among African-Americans; the unemployment rate of African-Americans dropped 1.1% to 13.2%
    • Economy adds 146,000 jobs; more than were predicted.  Private sector jobs increased by 147,000; government jobs decreased this month by 1,000.  
    • October jobs numbers were adjusted downwards by 49,000.  48,000 jobs of this revision were in the government sectors.  We have 416,000 more jobs than we had in August, or an increase of 139,000 jobs in each of those months.  
    • Manufacturing jobs declined by 7,000; private service-producing jobs increase by 169,000.   
    • Unemployment remained at 3.8% for people 25 and over with Bachelor's degrees or higher.  The unemployment rate for young people under 25 with Bachelor's degrees or higher and not currently in school remained at 7.0%.
    • The unemployment rates for high school graduates with no college and for people with Associate's degrees or some college dropped, from 8.4% to 8.1% and from 6.9% to 6.5% respectively.
    • Employment continued to increase the most among people 55+ years of age.  (It would be best to assume that this increase does not represent older people getting hired as much as it represents employed people turning 55 and aging into this older age group.)
    • 198,000 more full-time workers this month; 337,000 fewer part-time workers.  We have 2,445,000 more full-time workers than we had a year ago.
    • We have about 190,000 MORE self-employed workers than we had last month and we have 262,000 MORE self-employed workers than we did a year ago.  (The number of self-employed workers tends to be volatile.) 
    • 2,648,000 more people employed than a year ago.
    • 1,294,000 fewer people unemployed than a year ago.
    • About 1,889,000 more jobs than we had a year ago.  (About 2,913,000 more jobs including benchmark revisions.)
    • 5.0 million more jobs in total than at the "trough" of the recession (including benchmark revisions); 5.6 million more private sector jobs than at the "trough" of the recession (including benchmark revisions).

    Now ready:

    Watch for the following updates throughout the next days:
     
    • Jobs Lost/Created Year by Year Since 1999
    • Private/government Jobs by Month for 2011 & 2012 
    • How Many Jobs Have Been Created/Lost Under Obama?  
    • How Many Jobs Lost/Gained in 2012 to date? 

    Tuesday, December 4, 2012

    Tax Exodus States: Oh, Really?

    Fox lies again:  People and Jobs Are Leaving in Droves!  (Or not..)    


    Fox News is making much noise about a Fiscal Times article that has highlighted five states that Fiscal Times claims people are leaving due to high taxes.  I guess people who lean right are so used to being lied to by various right-wing news outlets that they don't even question the data they read.  (Oh, life is so rosy in the red fog of the right!)  This particular story about people leaving these states in droves has no obvious sources.  Other than a reference to buy a survey on each of these states for $29.99.  


    There is talk about "out migration", but it is unclear over what period of time people are supposedly "out migrating" and what they exactly consider "out migrating".  For the five states out of which people are supposedly "out migrating" have all experienced increases in population.  So even if some are "out migrating", obviously other people are taking their place.  And there is no obvious evidence that people are "out migrating" due to taxes.  Generally, people have been moving out of the Northeast and Midwest for decades now, but all of those states have more than enough people either being born in the state or "in migrating" from somewhere to increase the populations of these states significantly.  


    Here are the five horrid states:


    You can read Fiscal Times' detail HERE, but the five states that people are supposedly leaving in droves are these:

    1.  Illinois, the home of Chicago, the home of Barack Obama, the state and the city that conservatives love to hate- and love to hold up as a bad example of... everything.  Illinois increased its state income tax temporarily from 3% to 5% two years ago.    

    2.  New York (actually tied with California according to the Fiscal Times).  I guess some rich guy feels that taxes are too high in New York, so he is taking off for Florida, wrote a letter to the New York Post, and that is all that anybody who reads the Fiscal Times needs to know.

    3. California, another state that conservatives love to push around and discuss what a "shambles" it is.

    4.  New Jersey, which has redeemed itself a bit since it elected a Republican governor.   

    5.  Ohio, as in "Let's kick the old Rust Belt state around again".  The author states:  "The interesting part about Ohio though, is that a constant stream has always existed out of the state. "  Does the author mean "exited"?  Any editors spell-checking over there?

    Rankings of These States in Terms of Job Growth

    This will be a two-part post; today we'll look at ranking of job growth or loss in these states as a percentage increase or decrease over the past two years; tomorrow we'll look at numbers of people employed and unemployed, again as a percentage increase or decrease, in these states over the past two years.

    Shouldn't the number of jobs be declining compared to states full of milk, honey, low taxes, and Republicans?

    Now, the article is about people actually packing up and leaving the state because, according to the author,  they can pay less taxes elsewhere.  But still, if these states were so horrible, one would think that, particularly in light of the recession, the numbers of jobs and numbers of people employed would be rapidly decreasing, especially compared to states full of milk, honey, low taxes, and Republicans.  These rankings compare all 50 states based on percentage increase or decrease in jobs.  "1" is the best; "50" is the worst. 

    1.  Illinois:  If taxes are so miserable in the Land of Lincoln (and Obama), we would expect that Illinois would be among the worst states in job growth over the past two years, wouldn't we?  My heavens, those dastardly Democrats raised the state income tax 67%!  Well, Illinois isn't leading the pack, but it's not in the dregs either.
    • Year over year, October 2011 to October 2012:    36 
    • Year to date, 2012:  33
    • Since December 2010:  34
    Not great, but not awful, and a lot better than its neighbor to the north, the home of "Let's give everything we've got to the corporations so that they will give us jobs" Governor Scott Walker of Wisconsin.  Since Walker got into office, Wisconsin ranks dead last in job growth.  Now Walker kept telling us that all of those Illinois companies were going to relocate north of the border to escape those horrible Illinois taxes, but that hasn't happened yet.  We're waiting:  Any day now, Scottie?

    Dead last.

    And when you look at raw numbers, it is even worse:  Wisconsin has actually LOST about 20,000 jobs since Scott Koch Brothers Walker took office.  Illinois, even with that "atrocious" tax rate and those horrible Democrats all over the darned place, has ADDED 69,000 jobs in the same amount of time.    

    2.  New York:  I can't help think of New York without envisioning Eva Gabor from Green Acres excitedly talking about "New York is where I'd rather be" while she throws clothes around after a shopping spree. 

    (Now remember that these numbers are for October, before Hurricane Sandy destroyed many beachfront communities as well as damaging a big part of lower Manhattan.  We can expect jobs numbers to go down over the next two months as state jobs numbers reflect the damage and as New York recovers.)

    But how is that horrible, overtaxing, Democrats-running-amok New York doing in terms of jobs?  New York's rankings compared to all 50 states:   
    • Year over year, October 2011 to October 2012:    17
    • Year to date, 2012:  19
    • Since December 2010:  13
    Hmmm... respectable numbers.  But, no, it just can't be.  For, as the article states:
    Tom Golisano, the founder of Paychex (NASDAQ:PAYX), wrote a letter that was published in the New York Post about why he was leaving the state. And he didn’t mince words, explaining he was taxed out of the state for greener pastures to no-income-tax Florida. And it shouldn’t be a shock, Florida welcomed him with open arms.
    Now, come on, New Yorkers, if this guy is moving to greener pastures a la Green Acres, why are the rest of you staying put?  Pack your bags and rush to Florida, where summer heat, Medicare fraud, Rush Limbaugh, and long voting lines await you-- with open arms, especially if you have a lot of bucks.

    Speaking of Florida, how are they doing down there?  Year over year:  30th.  2012 to date:  35th.  And since December 2010, when Medicare fraud Governor Rick Scott took over?  22th.  A bit better than Illinois, but not as good as New York. 

    By the way, in raw numbers, New York has added 239,000 jobs since December 2010, and Florida has added 154,000.    

    3.  California, the much-abused state that conservatives love to hold up as good example of a lousy state, and of course, another state with Democrats running amok; those nasty Communist Dems even have a super-majority now.  Can socialized medicine and gulags be far behind?

    According to the people at the Fiscal Times, people are just jumping over that border heading for that relative tax haven Nevada.  So California's job ratings?       
    • Year over year, October 2011 to October 2012:    9
    • Year to date, 2012:  13
    • Since December 2010:  10
    And how is that tax haven neighbor Nevada which supposedly is taking in thousands of California refugees?

    38th year over year, 37th in 2012 to date, and 25th since December 2010.

    Of course, Nevada is a much smaller state than California, but still.  California has added 410,000 jobs since December 2010 and Nevada has added 20,000.  But just don't stand too close to that Nevada/California border; you don't want to get stampeded by those Californians jumping that border into low-tax Nevada.

    4.  New Jersey.  Another long-time blue state, even though Chris Christie, the Obama-hugging governor, is a  Republican.  "Including local taxes, New Jersey has the highest tax rate in the country."  So, of course, we're going to have to see a decrease in the number of jobs up there, right?  Anyone with any sense is making a dash for the cash in some other state.

    And New Jersey's jobs numbers aren't wonderful compared to other states, but they aren't really miserable either; pretty much on the order of the jobs numbers in Illinois (Again,these numbers precede Hurricane Sandy):     
    • Year over year, October 2011 to October 2012:    34
    • Year to date, 2012:  36
    • Since December 2010:  32

    5.  Ohio.  People have been kicking Ohio around for decades now.  It was a Rust Belt state which people were leaving when we Baby Boomers were kids.   
    • Year over year, October 2011 to October 2012:    13
    • Year to date, 2012:  10
    • Since December 2010:  14
    Yep.  Stunningly, that Rust Belt state is actually doing pretty darned well in job growth.  Oh, that's right!  Now that state DID elect a Republican governor and they now have Republicans running amok all over the state.  That must be it!  It couldn't have anything to do with the auto rescue, because all of the Fox-listening Tea Party people KNOW that government stimulus doesn't work (unless it's stimulus of defense contractors).  And the auto industry deserved to go bust because they still use demanding, unionized workers and conservatives all know that unionized workers are lazy and insist on livable wages and health insurance, which is a bad thing.  (Hopefully by now, you've figured out the sarcasm?)  


    So.. Where's the data as to people leaving these various states?


    I just looked at the BLS civilian non-institutional numbers of people 16+ for these various states (which comes from the Census), and those numbers have been going up consistently for the five states listed above. Even Ohio has gained in population consistently since 1976.


    So.. who is leaving and where do you get your numbers, Fiscal Times?  And, no, I'm not going to pay $29.99 per state to find out.


    Let's make it clear that people come and go all of the time.

    Some people are leaving all of the states and others enter all of the states, but there is no obvious evidence from raw Census numbers that people are leaving the states mentioned in droves, and there is plenty of evidence that, despite some people heading for the hills, the states mentioned in this article continue to increase in population.
    And, more to the point, the states pilloried by the Fiscal Times and Fox News aren't doing that badly in jobs.  Tomorrow I'll also post my article ranking all of the 50 states in terms of percent of jobs over the past two years.

    Fun and Games at the Fiscal Times?

    Hmmm... I should check out the Fiscal Times more often...  There's an article entitled "The Myth of Being Rich at 250,000 a year."  Oh, boo-hoo, let's all cry for people making $250,000 a year.  They aren't Mitt Romney and some of them even have to work for their $250,000 a year.   Maybe I'll venture over there and read that article tomorrow.    
    Note:  My numbers are taken from the numbers of jobs for the 50 states according to the Regional State Employment and Unemployment report as reported in Table 5 Total and the individual databases for jobs, numbered  SMS01000000000000001 through SMS54000000000000001.  Data is copied to a spreadsheet on my computer for purposes of calculating percentages and rankings.