AUG#: +130,000 jobs.

Unemployment up at 3.7%...AUG jobs under Trump HERE

Showing posts with label unemployment claims. Show all posts

Thursday, March 28, 2013

Weekly New Claims Numbers Pop Up

March 2013 reports will be released Friday, April 5th.  Check back then!

Weekly unemployment initial claims popped back up this week after a downward trajectory for the past month.  Unemployment claims have increased two out of the last five weeks. 


First time unemployment jobless claims increased to 357,000  for the week ending March 23rd.   This is an increase of 16,000 but it the first time in a month in which weekly first time initial claims popped above 350,000.  It is unclear whether or not this is a trend, as the Department of Labor also readjusted seasonal adjustments with this week's report.  Weekly claims numbers to date showed that employers were NOT laying people off in response to the sequester.  It's really too soon to tell if this week's claims numbers have any meaning other than the usual weekly volatility.

The four-week moving average # of claims increased by 
2,250 after decreasing by 6,250 last week.  First time claims continue at about the same level that they were in late 2007 to early 2008.  


(Even though these numbers are seasonally adjusted, weekly claims numbers are always a bit volatile and should  only be analyzed in terms of a trend over a period of weeks.  See the graph below.) 


For the week ending March 9th, 5,455,757 people were receiving unemployment benefits under one of the programs that are available (regular state, federal extended unemployment compensation, or a few other smaller programs).  This was an increase of 86,750 continuing claims since the previous week.  The increase in continuing claims occurred in the Federal Extended Unemployment Benefits program (the "Tiers") whereas claims in the Regular State program (the first 20 to 26 weeks of unemployment benefits) decreased 40,000.


Percent of Unemployed People Receiving Benefits decreased to about 43.6% for the week ending March 9th.


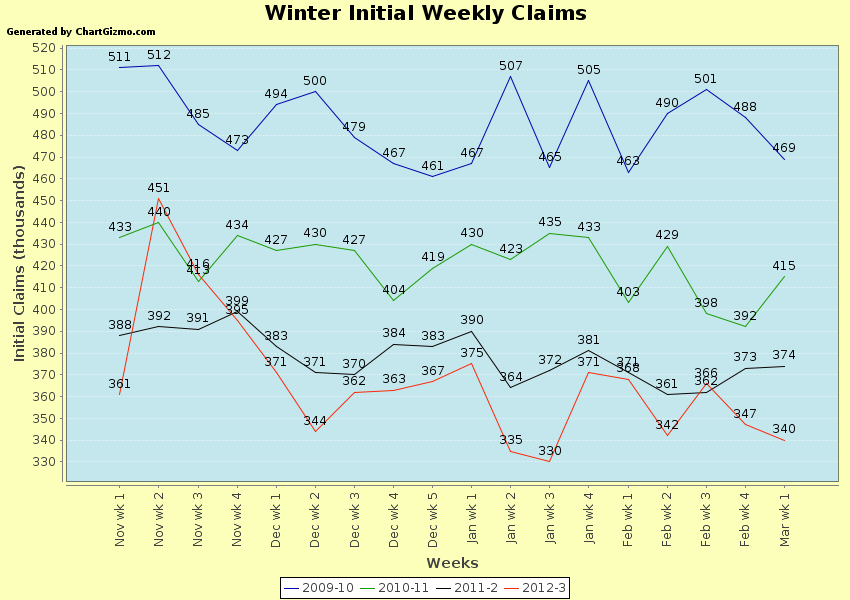
The chart above is one of the BEST charts for understanding and observing changes in the weekly initial claims numbers over time.  This year (red:  2012-13) and the past three years (blue:  2009-10, green:  2010-11 and black:  2011-12) are marked in different colors.  You can see that, as a trend, first time claims for unemployment have declined from one year to the next, even though there are variations within the year.  You can also see the impact of Hurricane Sandy on claims in November 2012.  Though the number of initial unemployment claims has been variable over the past three months, it has continued a downward trajectory.  

Be aware that:
  1. The graph above shows first time claims, so people who have continued to receive benefits or who have lost unemployment benefits are not counted in these numbers.  
  2. They are seasonally adjusted, so most variations caused by weather or holidays are already included in these numbers.  
  3. As these are weekly numbers, they are more volatile than the monthly numbers.


First time unemployment claims increased by 16,000 over those reported last week.  Last week's initial claims numbers were revised upwards by  5,000. in seasonally adjusted numbers, but they were only revised upwards by about 1,800 in unadjusted numbers.  There are usually slight upwards revisions  (1,000 to 3,000) in the numbers of initial claims in most of the weeks of the past several months.  Numbers reported this week also reflected changes in seasonal adjustments.  (The chart above shows REVISED claims numbers.)

As usual, to put this into perspective, check out the red line on the chart above to see where jobless claims are now, in late 2012/early 2013, compared to the past three years.

From the current report:
In the week ending March 23, the advance figure for seasonally adjusted initial claims was 357,000, an increase of 16,000 from the previous week's revised figure of 341,000. The 4-week moving average was 343,000, an increase of 2,250 from the previous week's revised average of 340,750.
The initial claims as announced last week were 336,000, so the claims from that week were revised upwards by 5,000. 

Thursday, March 14, 2013

Weekly Unemployment Claims REALLY Down


We have a trend...  Unemployment claims have declined four out of the last five weeks. 


First time unemployment jobless claims decreased to 332,000  for the week ending March 2nd.   This is a decrease of 10,000 but, more important, it appears to mark a solid trend of weekly first time initial claims below 350,000.  It also shows that so far employers are NOT laying people off in response to the sequester; however, as was mentioned last week, the effects of the sequester on employment may occur farther down the road.

The four-week moving average # of claims decreased by 
7,000 after decreasing by 6,750 last week.  First time claims continue at about the same level that they were in late 2007 to early 2008.  


(Even though these numbers are seasonally adjusted, weekly claims numbers are always a bit volatile and should  only be analyzed in terms of a trend over a period of weeks.  See the graph below.) 


For the week ending February 23rd, 5,619,860 people were receiving unemployment benefits under one of the programs that are available (regular state, federal extended unemployment compensation, or a few other smaller programs).  This was an increase of 217,967 continuing claims since the previous week.  The increase in continuing claims occurred in both the Regular State Claims and the Federal Extended Unemployment Benefits program (the "Tiers").


Percent of Unemployed People Receiving Benefits increased to about 45% for the week ending February 23rd.


The chart above is one of the BEST charts for understanding and observing changes in the weekly initial claims numbers over time.  This year (red:  2012-13) and the past three years (blue:  2009-10, green:  2010-11 and black:  2011-12) are marked in different colors.  You can see that, as a trend, first time claims for unemployment have declined from one year to the next, even though there are variations within the year.  You can also see the impact of Hurricane Sandy on claims in November 2012.  Though the number of initial unemployment claims has been variable over the past three months, it has continued a downward trajectory.  

Be aware that:
  1. The graph above shows first time claims, so people who have continued to receive benefits or who have lost unemployment benefits are not counted in these numbers.  
  2. They are seasonally adjusted, so most variations caused by weather or holidays are already included in these numbers.  
  3. As these are weekly numbers, they are more volatile than the monthly numbers.


First time unemployment claims decreased by 10,000 over those reported last week.  Last week's initial claims numbers were revised upwards by  2,000.  There are usually slight upwards revisions  (1,000 to 3,000) in the numbers of initial claims in most of the weeks of the past several months.  (The chart above shows REVISED claims numbers.)

As usual, to put this into perspective, check out the red line on the chart above to see where jobless claims are now, in late 2012/early 2013, compared to the past three years.

From the current report:
In the week ending March 9, the advance figure for seasonally adjusted initial claims was 332,000, a decrease of 10,000 from the previous week's revised figure of 342,000. The 4-week moving average was 346,750, a decrease of 2,750 from the previous week's revised average of 349,500.


The initial claims as announced last week were 340,000, so the claims from that week were revised upwards by 2,000. 

Current January/February/March Initial Claims Continue to be the Lowest Since Late 2007/Early 2008.

As a whole, the current numbers of initial claims continue to be the lowest Winter initial claims numbers since late 2007/early 2008.
  

Continuing regular state claims, from people who are continuing to claim unemployment through the initial 20 to 26 week regular unemployment program, declined 89,000 for the week ending March 2nd after increasing 3,000 the week before.  3,024,000 people filed continuing regular state claims in the week ending March 2nd.  As a whole, continuing regular claims continue to decline despite some individual weekly increases.  (There were 3,394,000 continuing claims a year ago.) 

Total number of people receiving unemployment insurance is 45% of the officially unemployed for the week ending February 23rd.  

The weekly report also tells us the total number of people who are receiving unemployment benefits.  For the week ending February 23rd, 5,619,860 people were receiving unemployment benefits under one of the programs that are available (regular state, extended benefits, federal extended unemployment compensation, or a few other smaller programs).  This compares with 12,500,000 people who are unemployed in unadjusted numbers according to the monthly February unemployment situation report which was released Friday, March 8th.  Those numbers, showing that only 45% of the officially unemployed are receiving benefits, should make it clear that people do NOT need to be receiving unemployment insurance to be counted among the unemployed.  (This ratio and these two numbers are NOT seasonally adjusted.)

Extended Benefits (EB) Only Available in Alaska


Extended Benefits claims were only available in Alaska during the week ending February 23rd.  

As of the week ending February 23rd, only 549 people were still receiving Extended Benefits, as mentioned above.  As recently as late April 2012, 350,579 people were receiving Extended Benefits.  A year ago, 453,300 people were receiving Extended Benefits.

Therefore, over the last ten months, 99.8% of the people who were receiving Extended Benefits are no longer receiving such benefits.  We do not know how many of these 350,000 people found jobs, how many have another source of income in the family, and how many have nothing. 

To reiterate, while a decrease in the number of people FILING for initial claims is a good thing and indicates that fewer people are being laid off, a decrease in the TOTAL number of people getting unemployment insurance may only show that fewer people are eligible for unemployment insurance benefits.

Any questions or confusion, please leave a comment or email me!


Thursday, March 7, 2013

Unemployment Claims DOWN: A Trend?!


We may have a trend...  Unemployment claims decline three out of the last four weeks.


First time unemployment jobless claims decreased to 340,000  for the week ending March 2nd.   This is a decrease of 7,000 but it appears to mark a solid trend of weekly first time initial claims in the 340,000's (vs. jumping back and forth and up and down about 30,000 claims a week).  It also shows that so far employers are NOT laying people off in response to the sequester; however, the effects of the sequester on employment may occur farther down the road.

The four-week moving average # of claims decreased by 
7,000 after decreasing by 6,750 last week.  First time claims continue at about the same level that they were in late 2007 to early 2008.  The four-week moving average # of claims has not been this low since the week ending March 8, 2008.


(Even though these numbers are seasonally adjusted, weekly claims numbers are always a bit volatile and should  only be analyzed in terms of a trend over a period of weeks.  See the graph below.) 


For the week ending February 16th, 5,401,893 people were receiving unemployment benefits under one of the programs that are available (regular state, federal extended unemployment compensation, or a few other smaller programs).  This was a decrease of 362,275 continuing claims since the previous week.  The decrease in continuing claims was almost exclusively in claims in the Federal Extended Unemployment Benefits program (the "Tiers"), which accounted for about 60% of the decrease in continuing claims.


Percent of Unemployed People Receiving Benefits decreased to about 43.2%.


The chart above is one of the BEST charts for understanding and observing changes in the weekly initial claims numbers over time.  This year (red:  2012-13) and the past three years (blue:  2009-10, green:  2010-11 and black:  2011-12) are marked in different colors.  You can see that, as a trend, first time claims for unemployment have declined from one year to the next, even though there are variations within the year.  You can also see the impact of Hurricane Sandy on claims in November 2012.  Though the number of initial unemployment claims has been variable over the past three months, it has continued a downward trajectory.  

Be aware that:
  1. The graph above shows first time claims, so people who have continued to receive benefits or who have lost unemployment benefits are not counted in these numbers.  
  2. They are seasonally adjusted, so most variations caused by weather or holidays are already included in these numbers.  
  3. As these are weekly numbers, they are more volatile than the monthly numbers.


First time unemployment claims decreased by 7,000 over those reported last week.  Last week's initial claims numbers were revised upwards by  3,000.  There are usually slight upwards revisions  (1,000 to 3,000) in the numbers of initial claims in most of the weeks of the past several months.  (The chart above shows REVISED claims numbers.)

As usual, to put this into perspective, check out the red line on the chart above to see where jobless claims are now, in late 2012/early 2013, compared to the past three years.

From the current report:
In the week ending March 2, the advance figure for seasonally adjusted initial claims was 340,000, a decrease of 7,000 from the previous week's revised figure of 347,000. The 4-week moving average was 348,750, a decrease of 7,000 from the previous week's revised average of 355,750.
The initial claims as announced last week were 344,000, so the claims from that week were revised upwards by 3,000. 

Current January/February/March Initial Claims Continue to be the Lowest Since Late 2007/Early 2008.

As a whole, the current numbers of initial claims continue to be the lowest January/February/March initial claims numbers since late 2007/early 2008.
  

Continuing regular state claims, from people who are continuing to claim unemployment through the initial 20 to 26 week regular unemployment program, increased 3,000 for the week ending February 23rd after decreasing 91,000 the week before.  3,094,000 people filed continuing regular state claims in the week ending February 23rd.  As a whole, continuing regular claims continue to decline despite some individual weekly increases.  (There were 3,436,000 continuing claims a year ago.) 

Total number of people receiving unemployment insurance is 41% of the officially unemployed for the week ending February 16th.  

The weekly report also tells us the total number of people who are receiving unemployment benefits.  For the week ending February 16th, 5,401,893 people were receiving unemployment benefits under one of the programs that are available (regular state, extended benefits, federal extended unemployment compensation, or a few other smaller programs).  This compares with 12,500,000 people who are unemployed in unadjusted numbers according to the monthly February unemployment situation report which was released Friday, March 8th.  Those numbers, showing that only 43.2% of the officially unemployed are receiving benefits, should make it clear that people do NOT need to be receiving unemployment insurance to be counted among the unemployed.  (This ratio and these two numbers are NOT seasonally adjusted.)

Extended Benefits (EB) Only Available in Alaska


Extended Benefits claims were only available in Alaska during the week ending February 16th.  

As of the week ending February 16th, only 555 people were still receiving Extended Benefits, as mentioned above.  As recently as late April 2012, 350,579 people were receiving Extended Benefits.  A year ago, 473,762 people were receiving Extended Benefits.

Therefore, over the last ten months, 99.8% of the people who were receiving Extended Benefits are no longer receiving such benefits.  We do not know how many of these 350,000 people found jobs, how many have another source of income in the family, and how many have nothing. 

To reiterate, while a decrease in the number of people FILING for initial claims is a good thing and indicates that fewer people are being laid off, a decrease in the TOTAL number of people getting unemployment insurance may only show that fewer people are eligible for unemployment insurance benefits.

Any questions or confusion, please leave a comment or email me!


Friday, May 25, 2012

Initial Jobless Claims For the Past Four Years: How Quickly We Forget!

Look at how much our weekly initial unemployment (jobless) claims have decreased since those months shortly after Obama was inaugurated:


(See the August update at the bottom of this post.)


Things were pretty intense in late 2008/early 2009.  If you've forgotten, a quick look at this graph should refresh your memory.  (And weekly initial claims were already decreasing by the first week of March 2009, just a week or two after the ARRA stimulus was passed!)

Check out the red line on the chart above to see where jobless claims are now, in spring of 2012, compared to the springs of the past three years, especially spring of 2009 (blue line).

The charts I include in my weekly initial unemployment claims articles are among the BEST charts for understanding and observing changes in the weekly initial claims numbers over time.  This year (red-2012) and the past three years (black- 2011, green- 2010, and blue- 2009 ) are marked in different colors.  You can see that, as a trend, first time claims for unemployment have gone down SIGNIFICANTLY from one year to the next, even though there are variations within the year.  


Be aware that:  1.  These are first time claims, so people who have continued to receive benefits or who are losing any unemployment benefits would not be counted in these numbers.  2.  They are seasonally adjusted, so most variations caused by weather or holidays are already included in these numbers.  3.  As these are weekly numbers, they are more volatile than the monthly numbers.

Update as of mid-August:


Friday, March 23, 2012

Is it True that Fewer People Are Filing for Unemployment Now?

Are more or fewer people filing for unemployment now than last year or the year before?

The number of people getting laid off has continued to go down, down, down.

This chart shows the average number of first time unemployment claims (in thousands) for four weeks, ending with the third week of March, for the last six years.      
  • These are the seasonally adjusted numbers of first time unemployment claims.  First time unemployment claims are people who have just been laid off and are filing new claims for unemployment.
  • The number of initial claims was taken from THIS Department of Labor chart.  I averaged the seasonally adjusted number of initial claims for the last week of February and the first three weeks of March for the past six years.
  • The chart shows that we are now on a par with the number of claims in late February/early March 2008.